Curated OER
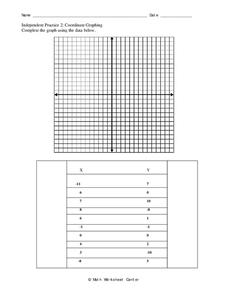
Coordinate Graphing
In this coordinate graph worksheet, 10th graders graph and complete 10 pairs of numbers on the illustrated gird. They graph each x point and label it on the graph. Then, students graph each y point listed on the graph and label those...
Curated OER
Campaign 2000
Learners research newspapers and the Internet to learn about the election. Students work in groups and choose a state that they want to compare to Florida. Learners organize the data they have found into a graph labeling an "x" and "y"...
Curated OER
Coordinate Graphs
Students use coordinate graphs in order to identify objects and their locations. They are shown how to plot the x and y coordinates and then are given values to be plotted during guided and independent practice. Students are assessed on...
Curated OER
ALASKA-CANADA HIGHWAY PROBLEM
Students create a table of ordered pairs, using variables (dependent and independent), writing equations, converting metric and standard measurements for distance using mileposts.
Curated OER
Let's Get Linear
Math whizzes utilize spreadsheets to examine linear modeling. They roll marbles down a ramp from three different heights and measure how far they roll. They use Excel to record their data and create a plot of their data.
Curated OER
Bungee M&M's
Science is exciting - and delicious! Pairs of learners set up a bungee cord type of experiment. They use buckets filled with M & M's, a meter stick, and a Slinky spring (as the bungee) to conduct their experiment. A good activity...
Curated OER
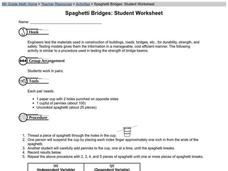
Spaghetti Bridges: Student Worksheet
Pairs of learners work together in order to simulate how engineers test materials for strength and safety in the real world. They use paper cups and pieces of spaghetti to run strength tests. This excellent worksheet should lead to...
Curated OER
Spaghetti Bridges: Student Worksheet
Here is a wonderful activity that allows young engineers to try their hand at designing a bridge out of spaghetti! The activity explains the activity and also provides a graph for keeping track of the results. Very good!
Curated OER
Chemistry Review
In this chemistry review worksheet, students identify chemical changes, isotopes, ions, and chemical bonds. This worksheet has 32 multiple choice questions.
Virginia Department of Education
Quadratic Curve of Best Fit
Class members create a table of the number of chords that can be drawn given the number of points on a circle. Pupils analyze the data created, find a function to fit to it, and use the function to make further predictions.
02 x 02 Worksheets
Inverse Variation
Discover an inverse variation pattern. A simple lesson plan design allows learners to explore a nonlinear pattern. Scholars analyze a distance, speed, and time relationship through tables and graphs. Eventually, they write an equation to...
West Contra Costa Unified School District
Graphing Systems
Get hands on with solving systems of equations graphically. A solid lesson plan uses guided practice to show how to solve systems of linear equations. It allows time for sharing ideas and provides a printable matching activity to promote...
Curated OER
Unit 0 Review - Measurement Lab Equipment
Review questions like these can be used in your biology, chemistry, physics, or earth science classes! They assess scientists' understanding of laboratory measurement tools including graduated cylinders, thermometers, and balances. They...
Curated OER
My Family Crest
Pupils design a detailed drawing of their family crest. They incorporate imagery that's relevant to their family's life. Students consider the variety os shapes for the family crest- circles, ellipses, and triangles. They represent their...
Curated OER
Drug Sales Soar - Rate of Change
In this prescription drug worksheet, students answer short answer questions and create graphs on the sales of prescription drugs over a five year span. Students complete six questions.
Curated OER
Factoring Trinomials
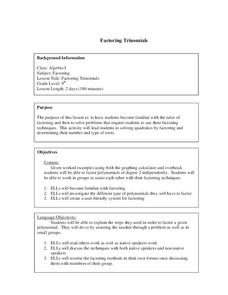
Students factor trinomials correctly. In this algebra lesson, students review the rules for factoring trinomials. They factor different polynomials as they relate the same concept and idea to facoring trinomials.
Curated OER
Bar Graphs
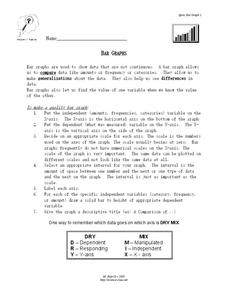
In this bar graph worksheet, students read about making quality bar graphs and they make a bar graph using given data. They answer 5 questions about their graph.
Curated OER
Olympic Bar Graphs
In this Olympic bar graph worksheet, young scholars pick a sport from the 2004 Olympic games and find data from the Olympic web page. They graph the scores (times, distance, or speed) and the medals. They answer questions about the...
Curated OER
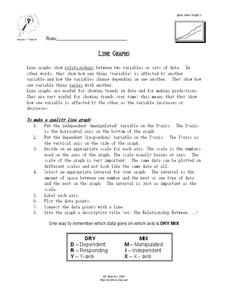
Line Graphs
In this algebra worksheet, students describe the relationship between a line graph and its data. They define the reasons line graphs are used and discuss increasing and decreasing lines. There is one involved questions, requiring several...
Curated OER
Distance Formula
Students determine the distance between two points. For this distance formula lesson, groups of students determine the distance between points in real life situations. They calculate the distance from one point in the school to another.
Curated OER
Graphing Speed; Slope
In this graphing speed worksheet, students find the slope in a position vs. time graph to be the speed. They are given example graphs of position vs. time to show the changes in slope reflect the changes in speed. Students match terms...
Curated OER
Scatter Plots
In this Algebra I/Geometry/Algebra II worksheet, students create a scatter plot and analyze the data to determine if the data show any type of correlation. The four page worksheet provides extensive explanation of topic, step-by-step...
Curated OER
Graphing Linear Motion
In this graphing linear motion worksheet, students answer 20 questions about velocity of objects, the distance they travel and the time. They interpret a graph of position vs. time and identify the velocity at certain point on the graph.
Curated OER
Exploring the Ares 1X Launch-Parameters
In this rocket launch worksheet, students solve 3 problems about the Ares 1X rocket and its launch, trajectory, and motion in both the vertical and horizontal direction.


