Curated OER
High and Low Tides
Students collect real world data from the Web regarding high and low tides at various locations in the United States. They find a function which models this data and make predictions on tide levels based on the information found.
Curated OER
Reading Graphs
Students plot functions on the Cartesian coordinate plane. They explore lines and parabolas. Students analyze graphs and answer questions about the information presented on the graph using an online program.
Curated OER
The Why and How of General Terms
Sixth graders find the recurrence relation for simple sequences
construct tables of values for a pattern. They find the value of the general term of a sequence algebraically.
Curated OER
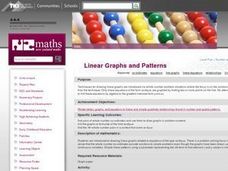
Linear Graphs and Patterns
Fifth graders find pairs of whole number co-ordinates and use them to draw graphs in problem contexts. They find and interpret the all meaningful pairs of whole number co-ordinates from graphs.
Curated OER
Diophantus II
Students use an ancient math game to establish the context for solving problems by investigating them in a systematic and mathematical way. They also need to have the ability to solve various types of equations.
Curated OER
Collecting And Fitting Quadratic Data
Students investigate the concept of using quadratic data to plot coordinates on a plane. They also apply the quadratic formula for a variety of problems with the help of a graphing calculator to draw the parabola for given coordinates.
Curated OER
Applications Of Rational Functions
Young scholars engage in a lesson that is about relational functions with the application of methods to real life problem situations. They use the examples found in the lesson for the purpose of practice during guided instruction....
Curated OER
Worksheet 34 - Fall 1995
For this math worksheet, students sketch the finite area whose boundary is composed of pieces of the curves x =1− y 4 and x = y2 − 1.
Curated OER
Life Expectancy at Birth
Students create a line graph on the life expectancy for males and females in Canada. In this math and health lesson plan, students review table and graph terminology, create line graphs, and analyze the differences in life expectancy...
Curated OER
Critter Encounter Chart
Students record data found at an assigned web site. In this data collection lesson, students access an assigned web site in order to complete a data chart about animals they see. They travel to different sections of the web site to find...
Curated OER
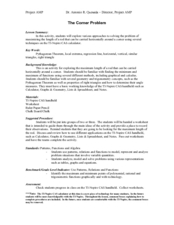
The Corner Problem
Students explore the concept of the corner problem. In this corner problem lesson, students use the TI-NSpire to determine the maximum length a rod can be and still pass horizontally around a corner. Students use similar triangles to...
Alabama Learning Exchange
Graphing Stations
Young scholars explore the concept of graphing stations. In this graphing stations lesson plan, students head to various teacher set-up stations involving slope, point-slope, standard form, parallel lines, etc. Young scholars work...
Alabama Learning Exchange
It's Around There Somewhere! Perimeter, and Circumference
Explore the concept of building equations for perimeter and circumference. Learners use rulers to measure the perimeter of half a sheet of paper. Then fold the sheet of paper numerous times, each time measuring perimeter. Learners use...
Curated OER
Representing Relationships with Equations
Learners explore Cuisenaire Rods. In this pre-algebra lesson, students work with a partner to generate addition problems with the sum of ten using Cuisenaire Rods. Learners construct examples of the Commutative Property using Cuisinaire...
Curated OER
Punch Mix-up
Fifth graders discuss the relationship between equivalent fractions, ratios, and proportions. In this fraction activity, 5th graders answer questions about a punch mixture in order to find the ratio of ingredients.
Curated OER
Gender and Income
Students investigate Income and gender preference. In this statistic lesson, students collect data of Income to see if one gender makes more than the other. Students examine the data and draw conclusions.
Curated OER
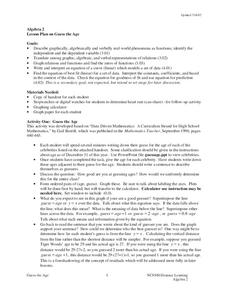
Guess the Age
Students explore functions using real world application. In this algebra lesson, students play a game as they apply concepts of function. They graph their findings and discuss it with the class.
Curated OER
Solving One Step Equations Using Algebra Tiles
Students solve linear equations. In this algebra lesson, students solve equations using addition, subtraction, division and multiplication. They evaluate and simplify functions.
Curated OER
Patterns That Grow
Students investigate growing patterns. In this additive patterns lesson, students analyze the core of growing patterns. Students extend additive patterns based on the core.
Curated OER
The football and Braking Distance; Model Data with Quadratic Functions
Students use the quadratic formula to solve application problems. The first problem relates to the path of a football thrown from the top of the bleachers. Students compute the time it will take the football to reach certain heights. In...
Curated OER
Which Bag is Which?
Learners explore number sense by completing a statistical analysis game in class. In this data graphing instructional activity, students utilize visual references such as colored cubes and tiles to map out the results of an experiment...
Curated OER
Introduction to Graphical Representation of Data Sets in Connection with Nuclear Decay
Students record data, make observations, and share in experimentation and discussion of numerical experiments.
Curated OER
Cups and Cubes
Third graders explore the use of cups and counters as a model to analyze the effects of operations. They create and use a rule to create a sequential pattern and use cups and cubes to model the relationship.
Curated OER
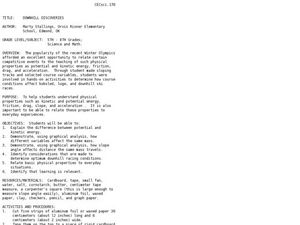
Downhill Discoveries
Learners are involved in hands-on activities to determine how course conditions affect bobsled, luge, and downhill ski races.


