Curated OER
Publisher Brochures
Students create brochures on subjects they are studying in Publisher. In this nonfiction writing lesson, students use Publisher to create a brochure telling all the main ideas of a topic they are studying. Students use text boxes, fonts...
Curated OER
Beginning Graphs in MS Excel
Students practice creating graphs in Microsoft Excel. In this technology lesson, students conduct a random survey and collect data. Students use the Microsoft Excel program to create a bar graph of the data.
Curated OER
How to Graph in Excel
Fourth graders construct data graphs on the Microsoft Excel program. In this statistics lesson, 4th graders formulate questions and collect data. Students represent their results by using Excel.
Curated OER
Excel for Beginners
In this Excel lesson plan, young scholars set a formula to check their homework. Students also use clipart, work in groups, and learn to use the tools in the drop-down list.
Curated OER
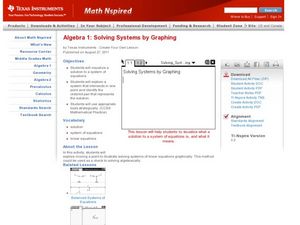
Solving Systems by Graphing
Solve systems of equations with your super smart upper graders. They solve systems of equations and then graph two lines to find where they intersect. The focus on the activity is to have learners explore moving a point to illustrate...
Curated OER
Characteristics of Exponential Functions
What can an upper grader do with an exponential function? They can solve and graph it, identify its important characteristic, and differentiate graphs based on shifts in graph bases that are greater or less than one. This 45 minute...
Curated OER
Exponential Functions f(x) = abx
Students define exponential functions and graph the equation. In this algebra instructional activity, students discuss exponential growth and decay as they graph their functions. They differentiate between the base of growth and decay.
Curated OER
Families of Functions
Learners use sliders to change the parameters of functions and examine how shifting parameters affects a graph. They identify the parameters of functions, find vertical and horizontal stretches, then calculate the scale factor and other...
Curated OER
Domain and Range 2
How do you identify the domain and range of the function? As learners find out it's as easy as creating a graph. They'll identify the domain and range of a relation from its graph, write symbolic expressions describing the relationship...
Curated OER
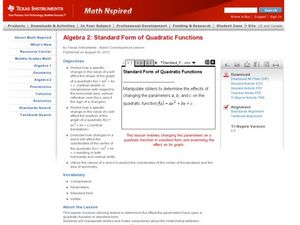
Standard Form of Quadratic Functions
Learners factor quadratic equations. In this algebra lesson, students identify the factors and use them to graph the parabola. They find the parameters and vertex of each graph.
Curated OER
Permutations & Combinations
Young mathematicianss predict the outcome of an event. Learners solve problems using permutations and combinations. They use the TI calculator to see the different combinations and how the groupings occur.
Curated OER
Tessellations in Excel
Students complete an Excel project on tessellations. In this technology and math lesson, students discuss tessellations and their occurrences in nature. Students use the Excel computer program to create tessellations.
Curated OER
Transformations: Dilating Functions
Students dilate functions using transformation. In this algebra lesson, students complete vertical dilation, stretch and shrink. They perform reflection across the x and y axis.
Curated OER
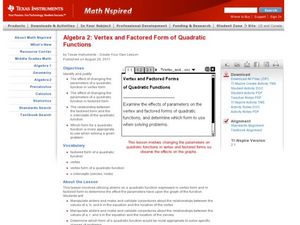
Vertex and Factored Form of Quadratic Functions
Students graph quadratic equations. In this algebra lesson, students solve quadratic equations by factoring. They identify the end behavior of the graph.


