Curated OER
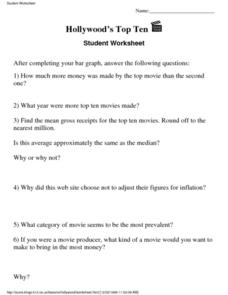
Hollywood’s Top Ten
In this entertainment worksheet, students answer 6 questions about their top ten favorite movies. The questions have no right answer because they are subjective.
Curated OER
Weather the Storm
Fourth graders complete multi-curricular activities for weather. For this weather lesson, 4th graders complete creative writing, research, and weather data analysis activities for the lesson.
Curated OER
Circle the Earth - Explore Surface Types on a Journey around Earth
Students use CERES percent coverage surface data with a world map in locating landmasses and bodies of water at Earth's Equator.
Curated OER
Probability
Fourth graders predict future outcomes with an investigation of the mathematical principle of probability using spinners constructed by them. The spinner is a hands on application an they combine it with writing a ratio for the...
Curated OER
Fair Trade: Chocolate Can Be Good For You
Young scholars discover the process of chocolate production. They read stories from boys in Ghana and Brazil who work on cocoa plantations. They illustrate the principles of fair trade.
Curated OER
Tracking Weather Over Time
Pupils gather, analyze and interpret data. They explain scientific inquiry. They plot points on a map and report information from a spatial perspective.
Curated OER
Patterns of Settlement in Early Alabama
Fourth graders study the settlement of Alabama. They collect data from the U.S. census website and answer questions regarding settlement patterns in the counties of Alabama in 1820. They write a paagraph describing where they would have...
Curated OER
Deer Hunting Pros and Cons
Students research, form an opinion, brainstorm pros and cons and support their own opinion after researching the pros and cons of deer hunting.
Curated OER
A Bird's Eye View of our 50 States
Third graders focus on state birds as they learned absolute location (latitude/longitude) of each state, as well as their relative location (bordering states).
Curated OER
Lewis and Clark
Ninth graders study the plants and animals Lewis and Clark discovered on their expedition. There is a plant illustrator, a plant recorder, an animal illustrator, and an animal recorder. They research the plants and animals and the ...
National Council of Teachers of Mathematics
The Math Forum: How to Make a Bar Graph
Site contains specific directions for making bar graphs using a Claris Works spreadsheet file.
Primary Resources
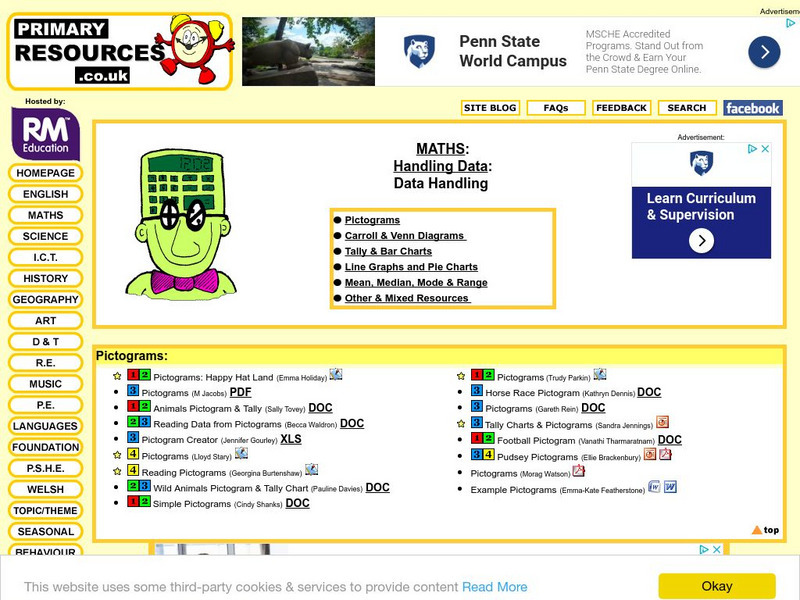
Primary Resources: Tally and Bar Charts
Lots of good materials for teaching about tally marks and bar graphs.
The Franklin Institute
Frankin Institute Online: Group Graphing
This site from The Franklin Institute explores how to make a simple graph using a spreadsheet to portray survey data. It also gives a set of interesting sports-related web sites so that students can get statistical inforamtion.
Better Lesson
Better Lesson: Graphing Our Snack Mix: Review of Graphing
Second graders review how to make bar graphs, line plots, and pictographs by tallying the contents of snack mix and building graphs to show their data.
National Council of Teachers of Mathematics
Nctm: Illuminations: Bar Grapher
A computer applet that will draw any bar graph with student's data input.
Digital History
Digital History: British Mercantilism and the Cost of Empire [Pdf]
Learn about the theory of mercantilism and how it affected the economies of the New England, Middle, and Southern colonies. Practice making a bar graph showing the value of exports to and imports from England between 1700 and 1774 with...
PBS
Pbs: The Lowdown: Living Wages in Ca: Ratio and Rate in the Real World
In this KQED infographic, find out how much an adult in different-sized households needs to make to pay for basic monthly living expenses. In the accompanying classroom activity, students solve real-life problems involving rate and ratio...


