Curated OER
Understanding Presidential History
Students research to find the qualifications necessary to be President of the U.S. In this presidential qualification lesson, students research their family roots to see if they could qualify to be President. Students create a graph to...
Curated OER
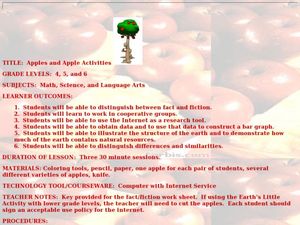
Apples and Apple Activities
Students investigate apples. In this reading comprehension activity, students read a book about apples then compare and contrast, make graphs, distinguish between fact and fiction and work in groups. Students work in...
Curated OER
Where the Buffalo Roam
Students lear about energy, energy efficiency and consumption. They measure energy use, graph the date, write a letter then design and present a PowerPoint on the topic.
Curated OER
Paper Dart Airplane
Learners create a paper dart airplane and measure its flight pattern. In this flight lesson, students follow the included directions to build their own paper airplane. The learners change the aileron configurations to see how it affects...
Curated OER
Moving Bodies
In this moving bodies worksheet, learners investigate how the amount of mass of a body in motion affects its tendency to remain in motion. Students use a meter stick as a ramp, marbles, string and a wooden block to determine how far a...
Curated OER
Map Making/Floor Plans/Map Reading
Students apply their knowledge of scale when mapping the classroom. They determine the use of a map legend and orient a map using a compass. They create the classroom maps using transfer graph paper.
Curated OER
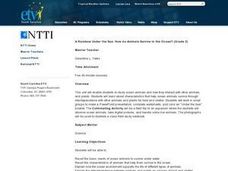
A Rainbow Under the Sea: How do Animals Survive in the Ocean?
Second graders read books, watch videos, complete worksheets and participate in class discussions about ocean animals. They, in groups, design PowerPoint presentations on selected marine animals.
Curated OER
The Weather and Recess #157
Students track the daily weather at recess time for a number of weeks. They design a bar graph of the different types of weather. They discuss how weather changes affect recess time. They write a list of optional recess activities for...
Curated OER
Weather for Health
Ninth graders encounter various types of numerical information (represented in multiple ways), much of which is abstract and difficult to comprehend. In this lesson, 9th graders will convert given information into bar graphs. In the...
Curated OER
What's Your Favorite Stuffed Animal?
Second graders gather information in a survey and interpret the results using a tally chart, a table, and a bar graph. They' present their results of the during the final group discussion. The subject of the survey is favorite stuffed...
Curated OER
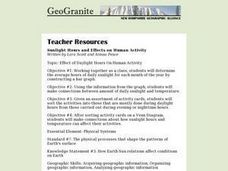
Effect of Daylight Hours on Human Activity
Students determine the average hours of daily sunlight for each month of the year by constructing a bar graph. They develop a understanding of how the amount of daylight hours varies by month and how that affects both temperature and...
Curated OER
Aerology- The Study of Mars
Young scholars investigate various aspects of the planet Mars. They examine a core sample that is simulated to make observations. Then compare the known sample with one that is unknown and differentiate between the two. Students...
Curated OER
What is a Tropical Rainforest?
Students investigate amounts of rainfall in selected world rainforests by creating a bar graph showing rainfall in inches for each. They convert inches to millimeters, and solve word problems having to do with rainfall in selected world...
Curated OER
Ratios Through Social Studies
Pupils analyze and integrate mathematical concepts within the context of social studies. They gather, present and analyze information on a bar graph, pie chart, etc. Students compute ratios. They demonstrate that ratios have real-world...
Curated OER
Savings and Stocks
Work together to brainstorm answers to different questions related to the savings of American people. Draw a bar graph representing stocks. Practice using new economic terms as well.
Curated OER
Interpreting Data and Statistics
Students define terms and analyze data. In this statistics activity, students plot their data using bar and line graphs. They analyze their data after they graph it and apply the results to the Great Depression.
Curated OER
Recording Frequency
First graders analyze nursery rhymes and gather data about word frequency. For this frequency lesson, 1st graders create graphs and tables. Students interpret the data.
Curated OER
French Fry Fun: Estimating and Measuring
Third graders demonstrate their estimating and measuring abilities. In this length measurement lesson, 3rd graders produce estimates of how long a handful of French fries will be before physically measuring them. Students...
Curated OER
Areology-The Study of Mars
Students examine core samples from Mars and discover what they can use it to tell the history of Mars. In this core sample lesson students create and analyze their own core samples then eat them at the end.
Curated OER
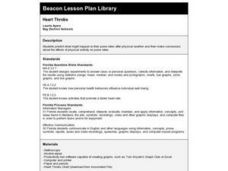
HEART THROBS
Students predict what might happen to their pulse rates after physical exertion and then make conclusions about the effects of physical activity on pulse rates.
Curated OER
Clouds
Students explore basic cloud types and the weather associated with each one. In this earth science lesson, students participate in numerous activities including going outside to observe the clouds they see, making a cloud in a...
Curated OER
Probabilities for Number Cubes
Students explore the concept of probability. In this probability lesson, students roll a six-sided number cube and record the frequency of each outcome. Students graph their data using a frequency chart and keep tally marks...
Curated OER
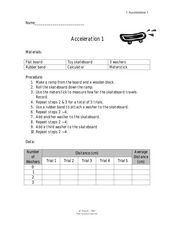
Acceleration 1
In this acceleration worksheet, students use weights to increase the mass affecting the force on moving objects. Students plot a graph of their data and answer 3 questions about how the acceleration of the toy skateboard used in the...
Curated OER
Crime Watch
Young scholars analyze the recent rise of homicides in some American cities, create and share posters, and write reflective essays in the form of letters to community leaders.

