Curated OER
Do Not Open Until May 2000!
Students create a time capsule. For this time capsule lesson, students collect and record data about themselves to be stored in a time capsule that will be opened at the end of the year.
Curated OER
Tally Chart Practice
In this tally chart instructional activity, students will read about tally charts and their uses. Students will make a list of when and why they could make a tally chart. Next students will complete a tally chart and write statements...
Curated OER
Collect Data Using a Transect Line
Middle schoolers learn about transect lines through a study of marine debris. In this marine debris lesson, students calculate the items on a transect line and graph them. Middle schoolers complete a category worksheet.
Curated OER
Excel Lesson Plan Coin Statistics
Second graders determine the difference between making a prediction and determining actual information. They design a spreadsheet for a coin flipping activity on which they include their predictions and what actual happens when they flip...
Curated OER
Seasons and Cloud Cover, Are They Related?
Students use NASA satellite data to see cloud cover over Africa. In this seasons lesson students access data and import it into Excel.
Curated OER
Growing a Seed
Seeing how seeds grow into plants is such an enjoyable for students! They plant lima bean seeds and take pictures to record the growth of their plants. Students write in a journal to describe their daily observations of their plants, and...
Curated OER
Mars Landing Site
Students, through the use of candy bars at room temperature, explore the problems selecting a landing site on Mars.
Curated OER
WHAT IS THE POPULAR COLOR?
Fourth graders graph cars according to their colors. They complete the graph including a title, scale, x-axis, and y-axis. Students collect the data and choose the type of graph to be made.
Curated OER
Creating Climographs
Students chart statistical information on graphs, interpret the information and use it to explain spatial relationships, and identify the relationship between climate and vegetation.
Curated OER
Floating on Salt Water
Mixing substances together causes their properties to change. This resource illustrates that concept for fifth graders by having them consider four questions that have to do with buoyancy and boiling point. Learners begin to understand...
Curated OER
Building Sets of 13 and 14
Compose and decompose sets of 13 and 14 and compare sets of each with your little learners. They use objects to construct sets of 13 and 14, record their answers, and compare sets in several different ways.
Curated OER
Environmental Studies: The Power of Wind
Investigate the prospect of wind as a renewable resource. Second and third graders make a pinwheel, answer critical thinking questions, and then attempt to use wind power to wind string. I would be more apt to use this lesson in a 1st or...
Curated OER
Introduction to Graphical Representation of Data Sets in Connection with Nuclear Decay
Students record data, make observations, and share in experimentation and discussion of numerical experiments.
Curated OER
Bubbles
Third graders perform an experiment using different mixtures of dishwasher detergent. They construct bar graphs that record their bubble data for each detergent set.
Curated OER
Parts of a Whole
Fourth graders explore fractions through the analysis of various paintings. They view and discuss paintings by Picasso and Seurat, discuss the fractional examples in the paintings, and create a bar graph.
Curated OER
Recycling Bottles
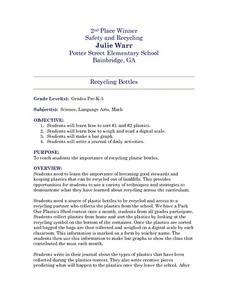
Students learn how to sort #1 and #2 plastics and how to weigh and read a digital scale. The bags are then collected and weighed on a digital scale and the information is used to make bar graphs. They also write in their journal about...
Curated OER
The Great Turkey Walk
Young scholars formulate questions that can be addressed with data and collect, organize, and display relevant data to answer them. They wcreate bar graphs and pie graphs
Curated OER
Food for Thought
Third graders conduct a survey of their class' favorite foods voting on 3-4 favorites overall. They then go to the computer lab and examine how to produce a horizontal bar graph by graphing the favorite foods of the class.
Curated OER
Let it Grow, Let it Grow, Let it Grow
Young scholars investigate, through a hands-on activity, in which type of soil a bean seed grows best. They create a bar graph representing each plant's growth in different soils.
Curated OER
Government
Second graders run for various offices. They dress up like a politician, pretend to be running for an office, and tell the students why they should vote for him/her. They explain why it is necessary for a community to have a government
Curated OER
Rolling Dice
Fourth graders investigate the mathematical concept of probability. They determine the given mean of a data set found when rolling dice. The results of the experiment are displayed using a bar graph. The teacher does an example before...
Curated OER
Wet Weather, Wet Climate
Students discover the differences between weather and climate in this long-term lesson introduction. They create rain gauges and practice reading rainfall measurements, view a website showing the cloud cover in their location and draw...
Curated OER
Jack and the Beanstalk Math
Students listen to Jack and the Beanstalk and determine what they think are the most common words. In this Jack and the Beanstalk lesson plan, students reread the story, count the words they chosen and graph those words. Students...
Curated OER
Conduction, Convection, Radiation, Oh My!
Middle schoolers draw a line graph, and use graphing as a tool to discover more about conduction, convection and radiation. They should design their own experiment using heat sensitive paper to show they explain these 3 processes.

