Hi, what do you want to do?
Curated OER
Graphing
Seventh graders identify the different graphs used in science. In this graphing activity, 7th graders analyze the three kinds of graphs. They construct a graph that best describes a given data.
Curated OER
Unit Circle Triangle
Students find the different ratios of a right triangle. In this geometry lesson, students apply the concept of the Pythagorean theorem as they identify the different angles and parts of a Unit Circle. They find the ratios of sine,...
Curated OER
Tailoring Two Cultures to Adapt to Wisconsin's Biotic Zones
Students examine the effect of the various ice ages on Wisconsin. In groups, they create a map representing the five geographic regions of Wisconsin. They must write out a description of each region to be placed on a poster board. ...
Curated OER
Math Vocabulary
In this math learning exercise, students examine the vocabulary terms and use them for review of the curricular goals or objectives. The sheet gives a review activity in the form of a crossword puzzle.
Curated OER
Obstacles On Wheels
Pupils practice roller blading in a safe environment offering varying levels of skill challenges (slanted rope).
Curated OER
Walking the Plank
Eighth graders experiment with a bathroom scale, books and a plank to determine how weight readings change as distance is applied. They graph and interpret the results.
Curated OER
Motion Capture and Analysis
Students capture the serve motion of a tennis player with a digital or video camera. Using transparencies or a software package, analyze the speed, acceleration, displacement and time of the racquet head and ball in the tennis stroke.
Curated OER
Double Exposure Lesson: Discussions And Experiments About Photography
Students explore photography. They compare/contrast the work of two photographers, create a paper viewfinder and experiment with focusing on topics, take photographs, and display photograph essays about the school.
Curated OER
Benthic Bingo
Middle schoolers identify organisms of a benthic community. They place the correct organism in the correct community and practice using marine terms. They play this game like a game of bingo.
Curated OER
Graphs Abound
Students create a survey for their classmates to collect data on their favorite foods, eye color, pets or other categorical data. They compile the data from the survey in a table and then make a bar graph of each category using a web tool.
Curated OER
Understanding Place Value
In this understanding place value worksheet, students, with a partner, problem solve and calculate the answers to seven place value exercises.
Curated OER
Olympic records through time
Young scholars compare the records of gold medal Olympic winners for the last 100 years and decide if we are faster, stronger than in the past.
Curated OER
Graph It
First graders collect classroom data (such as mode of transportation used to get to school) and prepare a pictograph to interpret the information.
Curated OER
Egg Fun
Learners complete experiments to find out if all eggs are same size, how they roll, and where is the air inside of the egg.
Curated OER
Air Quality Issues
Students study and chart the levels of the atmosphere. They determine volume and location of the whole in the ozone layer by problem solving and drawing Antarctica.
Curated OER
Graphing Inertia: An Oxymoron?
Eighth graders investigate Newton's Law of Inertia in order to create a context for the review of the use of different types of graphs. They practice gathering the data from an experiment and put it into the correct corresponding graph.
Curated OER
Translating Parabolas
Students make informed choices among technology systems, resources, and services. They select and apply technology tools for research, information analysis, problem solving, and decision making in content learning.
Curated OER
Little Magic Squares
Students and teacher talk about arrays of numbers like the ones in A Square of Circles. They check to see that the rows all have the same sum; that the columns all have the same sum; and that the diagonals have the same sum.
Curated OER
THE AREA OF A CIRCLE
Young scholars examine the relationship between circumference and diameter and how to use the formula to find the area of a circle. In this circle lesson students divide into groups and complete an activity.
Curated OER
Multiplication Facts for 2,5, and 10
Students practice multiplying by 2, 5 and 10. In this multiplication lesson, students participate in a teacher demonstration lesson of grouping for multiplication or making arrays. They concentrate on two's in this lesson and apply what...
Cool Math
Coolmath: Pre Calculus Horizontal and Vertical Lines Review
This CoolMath resource provides a review of horizontal and vertical lines.
Cool Math
Coolmath: Horizontal and Vertical Lines
A short tutorial explaining the linear equations of horizontal and vertical lines.
Khan Academy
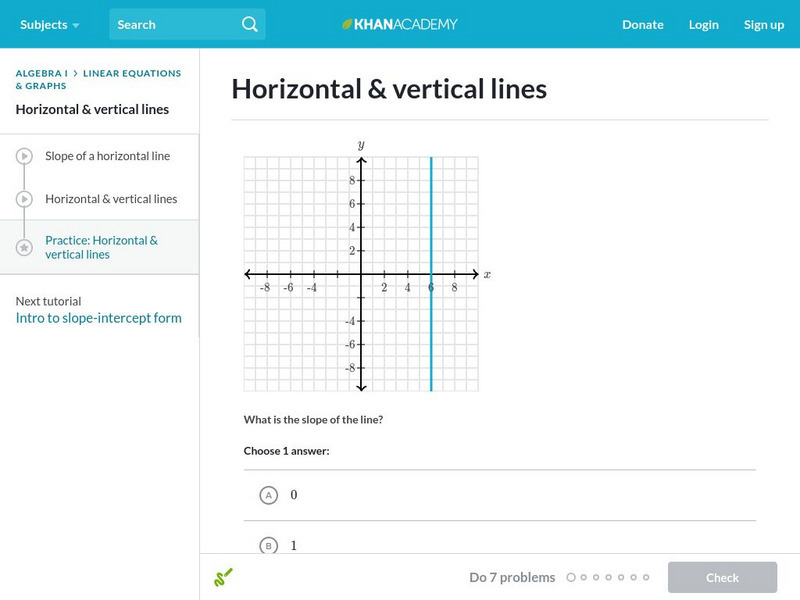
Khan Academy: Horizontal & Vertical Lines
Practice your knowledge of horizontal and vertical lines: their graphical presentation, their slopes, and their equations. Students receive immediate feedback and have the opportunity to try questions repeatedly, watch a video or receive...
CK-12 Foundation
Ck 12: Algebra: Horizontal and Vertical Line Graphs
[Free Registration/Login may be required to access all resource tools.] In this lesson students learn how to graph horizontal and vertical linear equations. Students watch videos, review guided notes and attempt practice problems.


