Curated OER
Math Probability Lesson Plans
"Defy the Pig" is a fun dice game that can be a great warm up activity to math probability lesson plans.
Curated OER
Super-Ball Physics
Students experiment with varied balls to determine the bounce factor in centimeters. In this physics lesson plan, students experiment to find the height a ball must be dropped from the have the highest bounce rate. Students graph the...
Curated OER
Identifying Points in the Coordinate Plane
For this ordered pairs worksheet, students identify 6 ordered pairs given a coordinate plane. Students list the ordered pair given the graph.
Curated OER
Plotting Points
In this middle school mathematics/Algebra I learning exercise, students plot points on a coordinate plane. The one page learning exercise contains six problems. Answers are not provided.
Curated OER
Graphing
Seventh graders identify the different graphs used in science. In this graphing lesson, 7th graders analyze the three kinds of graphs. They construct a graph that best describes a given data.
Curated OER
Mr./Ms.Scientist, This Is Your Life
Students create a timeline of ten events in chronological order about a scientist to include his/her accomplishments.
Curated OER
Tailoring Two Cultures to Adapt to Wisconsin's Biotic Zones
Students examine the effect of the various ice ages on Wisconsin. In groups, they create a map representing the five geographic regions of Wisconsin. They must write out a description of each region to be placed on a poster board. ...
Curated OER
ESL Activity - Beat the Teacher
Students play the game Tick-Tack Toe with the students. Teachers prepare a list of questions for the students, primarily to find out already known knowledge. Students try to beat the teacher at this game.
Curated OER
Turn Symmetry
Fourth graders observe geometric patterns to determine if they show rotational or point symmetry. They participate in the a demonstration lesson with a triangle. They create their own designs that show rotational or point symmetry.
Creative Chemistry
Combustion of Alcohols
For this combustion worksheet, learners complete two problems using a table showing the amount of heat released when different alcohols burn. They then create two graphs plotting the energy release against the number of carbon atoms.
Curated OER
How Chess Pieces Move
In this how chess pieces move learning exercise, 6th graders read how all of the chess pieces move, then answer one question about the moves of the rook using a grid.
Curated OER
Measuring & Graphing Motion
Fifth graders study how to measure distance. In this graphing motion lesson students complete a lab activity that shows them on the computer how to make graphs.
Curated OER
Intermediate Sentence Completion 6
In this ESL worksheet, students read 12 sentences with a missing adjective or adverb. From five choices, students choose the best word to complete each sentence.
Creative Chemistry
Evidence for Hydrogen Bonds Boiling Points of Various Compounds
For this hydrogen bonds worksheet, students create three graphs for comparison using three data tables showing the boiling points for various compounds containing hydrogen.
Curated OER
More Students Taking Online Courses
In this graph worksheet, students study a bar graph that shows the number of college students taking at least one online course. Students answer 4 problem solving questions about the data on the graph.
Curated OER
Bird Feeders
Students create environmentally friendly art. For this visual arts lesson, students follow the provided instructions to create hanging bird feeders.
Curated OER
Worksheet 18 Fall 1995
For each of the equations they find the values of the rational expressions. Then they differentiate each expression in relation to the value of t.
Curated OER
Math 155 Review Worksheet for Exam 1
In this college level calculus worksheet, students evaluate the given limits or show that the limit does not exist. Students determine the derivative of the given functions. The two page worksheet contains twenty-six...
Cool Math
Coolmath: Pre Calculus Horizontal and Vertical Lines Review
This CoolMath resource provides a review of horizontal and vertical lines.
Cool Math
Coolmath: Horizontal and Vertical Lines
A short tutorial explaining the linear equations of horizontal and vertical lines.
CK-12 Foundation
Ck 12: Algebra: Horizontal and Vertical Line Graphs
[Free Registration/Login may be required to access all resource tools.] Learn how to graph horizontal and vertical linear equations.
CK-12 Foundation
Ck 12: Algebra: Horizontal and Vertical Line Graphs
[Free Registration/Login may be required to access all resource tools.] In this lesson students learn how to graph horizontal and vertical linear equations. Students watch videos, review guided notes and attempt practice problems.
CK-12 Foundation
Ck 12: Algebra: Horizontal and Vertical Line Graphs
[Free Registration/Login may be required to access all resource tools.] Write and graph lines of the form y = a constant value and x = a constant value.
Khan Academy
Khan Academy: Horizontal & Vertical Lines
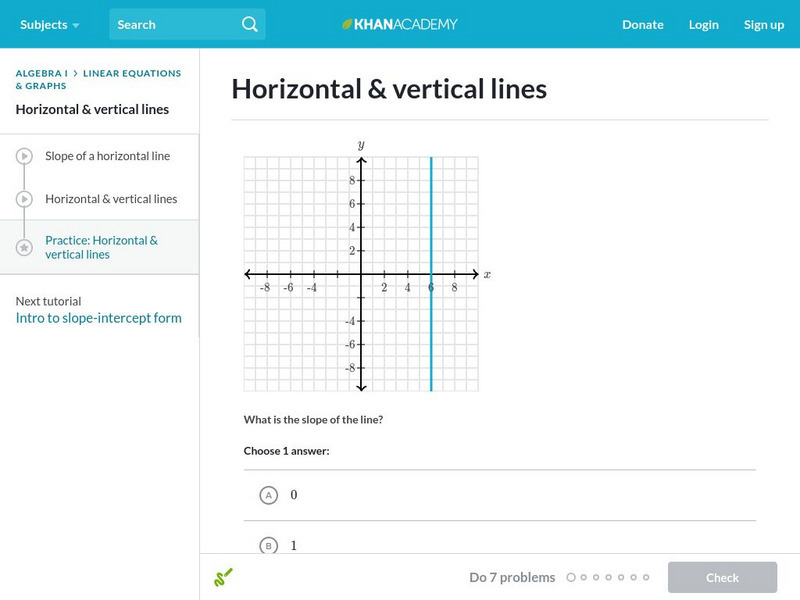
Practice your knowledge of horizontal and vertical lines: their graphical presentation, their slopes, and their equations. Students receive immediate feedback and have the opportunity to try questions repeatedly, watch a video or receive...


