Curated OER
Physical Properties of Group 1 Elements
In this elements worksheet, students complete a graphic organizer by filling in the symbol and atomic number for given elements. Students plot a graph of melting point against atomic number. Students write the electron arrangements for...
Curated OER
Line and Double Line Graphs: Reteach
In this graphing worksheet, students review the five steps for making a double line graph to display data. Students then use the graph they made following the shapes to answer the three questions.
Curated OER
Population Trends in the European Union
For this European Union population trends worksheet, middle schoolers compare and contrast the average age of a person in Iceland and Luxembourg as they respond to 6 short answer questions.
Curated OER
Births and Deaths: Birth and Death Rates in European Countries
In this European Union population worksheet, students examine birth and death rates in the EU as they follow procedures to create a scatter diagram.
Curated OER
Graphs, Three-Dimensional Coordinates
In this three-dimensional graphing worksheet students identify the coordinates of the vertex of shown figures. The first three shapes show all answers. The following 8 shapes are on coordinate dot paper, with all three axis shown and...
Curated OER
The Relationship Between Slope and Perpendicular Lines
In this perpendicular lines worksheet, students explore the relationship between perpendicular lines and slope in eight exercises and two worked examples. The solutions are provided.
Curated OER
Design Project: Simple component curve-tracer circuit
In this circuit worksheet students complete a series of short answer questions on using a tracer circuit. There are answers with this worksheet.
Curated OER
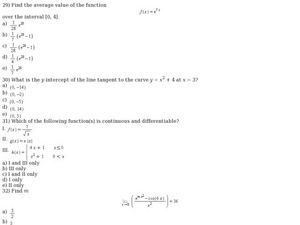
Find the Average Value of a Function
In this calculus learning exercise, 11th graders calculate the average value of a function. They find the line tangent to a curve and graph the equation. There are 15 questions.
Curated OER
Sixteen Multiple Choice AP Calculus BC Exam Preparation Questions
In this review for Calculus BC exam instructional activity, students solve sixteen various multiple choice problems. These problems are designed as review and preparation for the AP Calculus Exam.
Curated OER
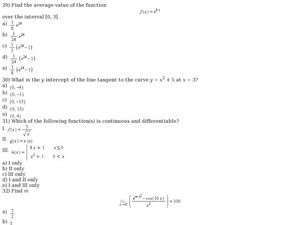
Converging Series
In this functions instructional activity, students calculate the average value, continuity, and the radius of convergence. There are 17 multiple choice questions.
Curated OER
Average Value of a Function
In this calculus worksheet, 12th graders calculate the line tangent to a curve and find the average value of a function. There are 12 questions.
Pennsylvania Department of Education
Introducing the Coordinate Plane
Fifth graders practice using estimation. In this estimation instructional activity, 5th graders add, subtract, multiple, and divide using whole numbers, fractions, and decimals. Students decide upon instances when estimation is more...
Curated OER
Unit Circle Triangle
Students find the different ratios of a right triangle. In this geometry instructional activity, students apply the concept of the Pythagorean theorem as they identify the different angles and parts of a Unit Circle. They find the ratios...
Curated OER
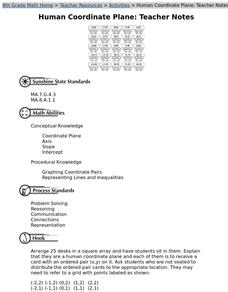
Human Coordinate Plane
Eighth graders form a human coordinate grid to develop knowledge of the placement and meaning of coordinates on a grid. They experience the placements of the x and y coordinates in an ordered pair.
Curated OER
Bungee M&M's
Eighth graders experiment with M&M's and a cup attached to a spring to to simulate a bungee jump. They graph the results of the experiment and make predictions for continuing the experiment. They determine the "line of best fit."
Curated OER
Graph It
First graders collect classroom data (such as mode of transportation used to get to school) and prepare a pictograph to interpret the information.
Curated OER
"Graph It"
Students work in teams to conduct short surveys of their classmates. They show their results using at least two different types of graphs.
Students separate into teams and are asked that each team to choose something that they are...


