Pennsylvania Department of Education
Problem Solving with Fractions
Solve story problems using fractions or decimals. Then, determine the reasonableness of answers using estimation.The detailed activity includes essential questions, vocabulary, a materials list, and links to related units.
Curated OER
How to Draw a Bar Chart Correctly
Your class has gathered their data, so what's the next step? They need to display and analyze their data, and a bar chart is a perfect tool for the job. This resource provides the step-by-step instructions those kids need to construct a...
Curated OER
Worksheet 29-Fall 1995
In this math worksheet, students label each of six integrals as true or false. They evaluate twelve integrals. Students evaluate the graph of a function.
Curated OER
Can You Count on Cans?
How can a canned food drive be connected to math? It's as simple as counting and organizing the cans! Children demonstrate their ability to sort non-perishable foods into categories that include soup cans, vegetable cans, boxed items,...
Curated OER
Usage and Interpretation of Graphs
Cooperative groups are formed for this graphing activity. Each group must construct a graph that represents how many eyelets (the holes for laces in shoes), are present in their group. A whole-class bar graph is eventually constructed...
Curated OER
Cartesian Coordinates
Students investigate rational numbers through data analysis and statistics. For this algebra lesson, students represent, rename, compare and order rational numbers. They collect and represent data correctly on a graph.
Curated OER
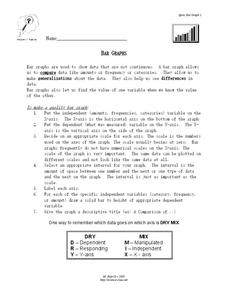
Bar Graphs
In this bar graph worksheet, students read about making quality bar graphs and they make a bar graph using given data. They answer 5 questions about their graph.
Curated OER
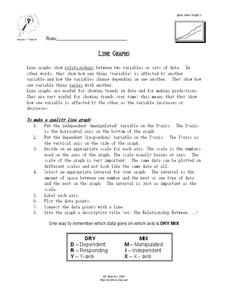
Line Graphs
In this algebra worksheet, students describe the relationship between a line graph and its data. They define the reasons line graphs are used and discuss increasing and decreasing lines. There is one involved questions, requiring several...
Pennsylvania Department of Education
Using the Coordinate Plane in Problem Solving
Fifth graders practice solving problems. In this fraction and decimal activity, 5th graders recognize the relationship between fraction and decimals. Students estimate problem results and write expressions to use for problem solving.
Curated OER
Scatter Plots
In this Algebra I/Geometry/Algebra II worksheet, students create a scatter plot and analyze the data to determine if the data show any type of correlation. The four page worksheet provides extensive explanation of topic, step-by-step...
Curated OER
Lesson 3: Graphing Ordered Pairs on a Coordinate Plane
Students study how to graph ordered pairs on a coordinate plane. After a teacher demonstration, students work together to complete problems. They explain and share their answers. As an activity, they solve a mystery story about the...
Curated OER
Distance Formula
Students determine the distance between two points. For this distance formula lesson, groups of students determine the distance between points in real life situations. They calculate the distance from one point in the school to another.
Curated OER
The Slope of a Line
In this slope worksheet, students examine graph and determine the slope of a line. They determine coordinates of a point to make a true statement. Students identify the dependent variable and the independent variable. This three-page...
Curated OER
Comparing Data on Graph A and Graph B
Second graders gather and graph data. In this graphing lesson, 2nd graders collect data and graph this information using tally charts, bar graphs, pictographs, or tables. They make predictions about the outcomes.
Curated OER
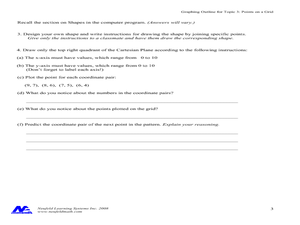
Concept: Points on a Grid
In this coordinate grid graphing worksheet, young scholars play a game of Battleship on the computer. They answer 21 questions about the coordinate grid and graphing.
Curated OER
Graphing Linear Equations
Ninth graders review the information that they have already learned
with regard to linear equations and graphical representations. They then assist in combining equations with a graphical element and complete various graphs with this...
Curated OER
Endangered Species
In this geography learning exercise, students identify how to manipulate data on a range of endangered species. They create a bar graph of endangered animals from Africa, Asia, Australia, North America, or South America. Students use a...
Curated OER
Linear Equations in Our Every Day World!
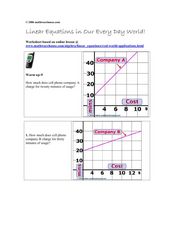
In this linear equations worksheet, high schoolers read and interpret graphed linear equations. They read a story problem, write a linear equation, and plot the points on a coordinate plane. This five-page worksheet cotnains 12 problems.
Curated OER
The Living Environment
Students use a spoon, clothespin, scissors, and toothpicks to simulate how animals get food in their environment. In this environment lesson plan, students learn about the adaptations animals make in order to survive.
Curated OER
Conics
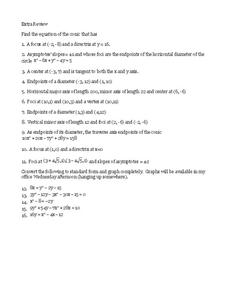
In this conic sections worksheet, 11th graders solve and complete 16 different types of equations. First, they find the equation of the conic that has a given focus and directrix. Then, students convert each given polynomial to standard...
Curated OER
Curve Sketching Review Worksheet
In this curve sketching activity, students solve 13 short answer and graphing questions. Students find maximums, minimums, critical points, turning points, increasing/decreasing intervals, etc.
Curated OER
Properties of Exponential Functions
In this algebra activity, students graph exponential equations and use the formula to translate the graph on a coordinate plane. There are 3 word problems.
Curated OER
The Great Grid
Students explore the coordinate plane. In this middle school/Algebra I instructional activity, students use dice with numbers and signs to play a game in which they must locate points on a coordinate plane. Students work in teams to...
Curated OER
Getting the Goods on Graphing
Students explore graphing. In this math lesson plan, students graph ordered pairs in the coordinate plane, write the coordinates of points shown on a plane, and create designs or pictures using ordered pairs.


