Curated OER
Graphing
Fifth graders create graphs based on climate in South Carolina. They read and interpret information in a chart and construct a graphy from the information in the chart. They create a spreadsheet using Excel and publish 2 graphs.
Curated OER
Graphing With Paper and Computers
Fourth graders construct bar graphs. In this graphing lesson, 4th graders create bar graphs in connection with the story, The Copycat Fish. After creating the initial graphs on paper, students use MS Excel to create graphs.
Curated OER
Graphing Iron Data
Students apply a data set to create a graph show how iron ore impacts an ecosystem. They explain how the iron effects the distribution and abundance of phytoplankton in coastal ecosystems using spreadsheet software.
Curated OER
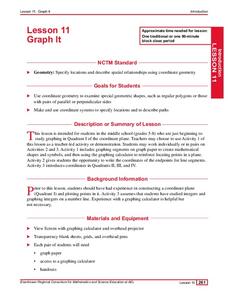
Graph It
Elementary and middle schoolers engage in a lesson of graphing in quadrant I of the coordinate plain. They use the graph to create shapes and symbols. While using a graphing calculator, they locate the points on the coordinate plane. In...
Curated OER
Excel Lesson Plan Coin Statistics
Second graders determine the difference between making a prediction and determining actual information. They design a spreadsheet for a coin flipping activity on which they include their predictions and what actual happens when they flip...
Curated OER
Graphing Your Favorite Pizza Topping
Fifth graders can survey the students just in their classroom, the grade level, or other grade levels. Upon finishing the surveys and compiling the data, the students can input their results in an Excel template or create their own...
Curated OER
Reading & Using a Nutrition Label
Students discover the importance of healthy eating. Using food nutrition labels, they read and examine the nutritional value. Students collect the data on a spreadsheet and create a graph. They analyze the media influences on product...
Curated OER
Data Analysis Challenge
In this data analysis worksheet, young scholars work with a partner to collect information for a survey. The information is then compiled into a graph. Students must indicate their survey question, the target audience, predict the...
Curated OER
It's Your Life - Safe or Sorry/Safety Issues
Middle schoolers examine and chart data about safety hazards and unsafe situations. In this safety hazard lesson, students examine newspapers and web sites to investigate injuries from safety hazards. They make a spreadsheet using the...
Curated OER
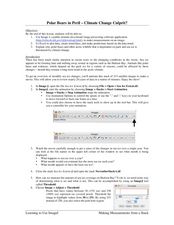
Polar Bears in Peril - Climate Change Culprit?
High schoolers explore the changes in sea ice over several years. In this life science instructional activity, students review and examine 20 years of data. They use Excel to graph data and analyze trends.
Curated OER
Graphing and Analyzing Biome Data
Students explore biome data. In this world geography and weather data analysis lesson, students record data about weather conditions in North Carolina, Las Vegas, and Brazil. Students convert Fahrenheit degrees to Celsius degrees and use...
Curated OER
The Stoichiometry Behind Pollution
Students research car emissions of various cars and find the toxins emitted. In this stoichiometry lesson, students calculate the relationship between reactants and products in a chemical reaction. Students collect data on...
Curated OER
Scatter-Brained
Seventh graders graph ordered pairs on a coordinate plane. They create a scatterplot. Additionally, they determine the line of best fit and investigate the slope of the line. Multiple resources are provided. An excellent resource!
National Wildlife Federation
I’ve Got the POWER! Solar Energy Potential at Your School
Should every school have solar panels? The 19th activity in a series of 21 has scholars research the feasibility of using solar panels at their school. They begin by gathering data on the solar energy in the area before estimating the...
Alabama Learning Exchange
What's Your Favorite Chocolate Bar?
Students complete a math survey. In this math graphs lesson, students complete a survey about their favorite candy bars. Students create different kinds of graphs using Microsoft Excel to show their results.
Curated OER
What's Your Favorite? Survey And Graphing Project
Sixth graders create and edit spreadsheet documents using all data types, formulas and functions, and chart information. They collect and organize data that be portrayed in a graph that they create using EXCEL.
Curated OER
Tracking Your Favorite Web Sites
Ninth graders track the hit count on their favorite web sites. In this Algebra I lesson, 9th graders record the number of hits on their favorite web site for twenty days. Students explore the data to determine if the relation...
Curated OER
Pet Count Excel Graphing
Students used collected data to distinguish what pets they have or would like to have. They correlate findings with appropriate technology--Excel. At the end of the lesson they tabulate a bar chart and present their findings to the class.
Curated OER
Lemonade Business
Twelfth graders use all features of Microsoft Excel and Microsoft Power Point to create charts and graphs. They use charts and graphs to make a Power Point Presentation.
Curated OER
Data Handling
In this data handling worksheet, students interpret data found in table, graphs and charts. They organize data and draw bar charts. This two-page worksheet contains 2 multi-step problems.
Curated OER
Student Costs Graph
Students calculate the mileage, gasoline costs, and travel time and costs for a vacation. They conduct a virtual field trip, and create a comparison graph of costs using Microsoft Excel software.
Curated OER
Wind Effects- A Case Study
Students explore hurricanes. In this weather data interpretation instructional activity, students draw conclusions about the impact of Hurricane Floyd as it related to weather conditions. Students read and interpret a tide data...
Curriculum Corner
8th Grade Math Common Core Checklist
Ensure your eighth graders get the most out of their math education with this series of Common Core checklists. Rewriting each standard as an "I can" statement, this resource helps teachers keep a record of when each standard was...


