US Department of Education
National Center for Education Statistics: Create a Graph Tutorial
This tutorial walks students through how to create different types of graphs using the Create a Graph tool available on the website. Covers bar graphs, line graphs, pie charts, area graphs, scatter plots, and dependent and independent...
Scholastic
Scholastic: Bars, Lines, and Pies
Students will learn and reinforce skills for creating, applying and analyzing pie charts, bar graphs and line graphs.
Paul Dawkins
Paul's Online Notes: Algebra: Lines
Detailed math tutorial features notes and examples that discuss graphing lines and introduces the concept of slope, the standard form of the line, the point-slope form, slope-intercept form, and parallel and perpendicular lines.
Better Lesson
Better Lesson: The Double Number Line
The double number line will help students figure out problems that involve two quantities.
Khan Academy
Khan Academy: Parallel & Perpendicular Lines From Graph
Given points that two lines go through or the graph of each line, classify the lines as parallel, perpendicular, or neither.
National Council of Teachers of Mathematics
The Math Forum: Graphing Linear Functions
Use this guide to practice graphing linear functions using Claris Works with your students. The lesson walks you through the process of setting up Claris Works step-by-step.
Illustrative Mathematics
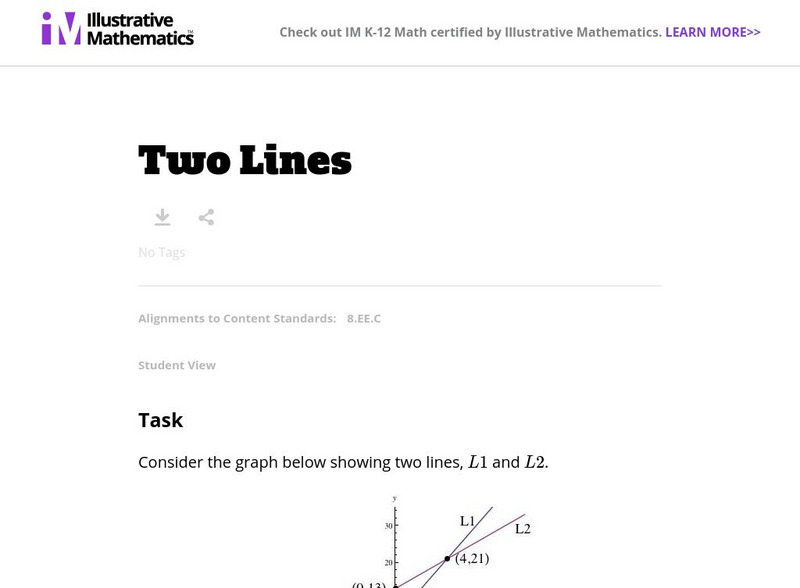
Illustrative Mathematics: 8.ee Two Lines
This task presents students with two line graphs. They are asked to find the linear equations and to identify points unique to each graph. Aligns with 8.EE.C.
Interactive Mathematics
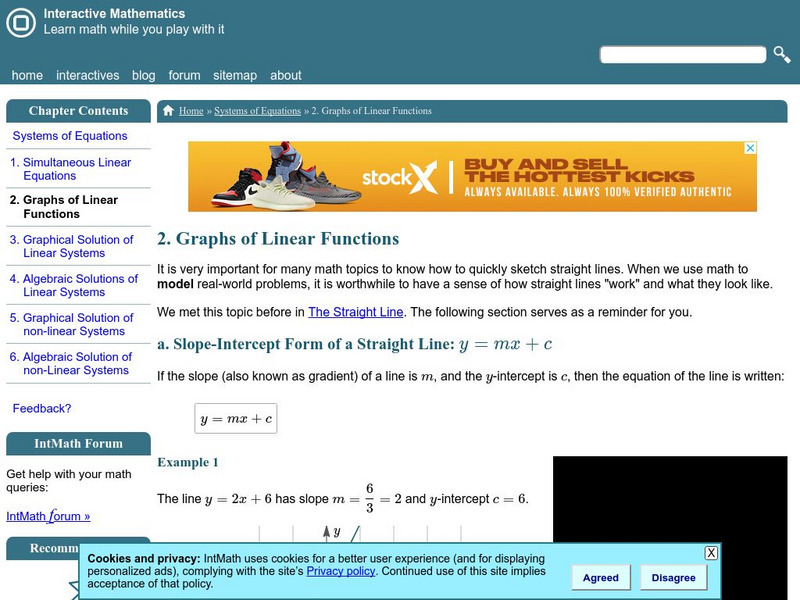
Interactive Mathematics: Graphs of Linear Functions
A brief overview of three methods used to graph lines is presented through examples. Slope-intercept, point-slope, and intercept form are demonstrated step-by-step along with a review of the formula for finding the slope of a line.
Shodor Education Foundation
Shodor Interactivate: Vertical Line Test
Learn about the vertical line test for functions by trying to connect points in the plane to build a function. When you have connected all of the points, you will be told if your graph is a valid graph of a function.
PBS
Pbs: Logical Leaps: Graphing Inequalities: Rational Numbers
In this interactive, use logic to solve three riddles involving a jumping wallaby competition. Then, using knowledge of inequalities and rational numbers, place the wallabies on the correct range from -5 to 5 on the number line. Numbers...
PBS
Pbs: Logical Leaps: Graphing Inequalities: Fractions, Mixed Numbers, and Decimals
In this interactive, use logic to solve three riddles involving a jumping frog competition. Then, using knowledge of inequalities and rational numbers, place the frogs in the correct range from 0 to 5 on a number line. The fractions,...
PBS
Pbs: Logical Leaps: Graphing Inequalities: Fractions and Decimals From 0 to 1
In this interactive, use logic to solve three riddles involving high-jump performers in a flea circus. Then, using knowledge of inequalities, place the fleas in the appropriate range on a vertical number line. Numbers are randomized so...
California State University
Ca State University, San Bernadino: Graphing Techniques
A survey of math graphing techniques includes horizontal and vertical shifts, stretching, lines of symmetry, even and odd functions, and absolute value functions.
Student Achievement Partners
Illustrative Mathematics: Equations of Lines [Pdf]
In this lesson, students are to interpret graphs with equations of lines.
Khan Academy
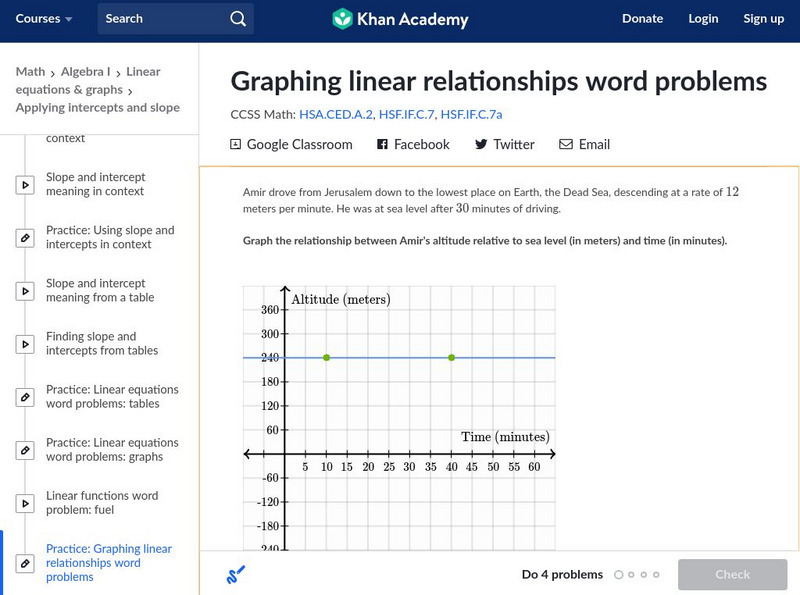
Khan Academy: Graphing Linear Functions Word Problems
Graph the line that represents a real-world relationship that is given verbally. Students receive immediate feedback and have the opportunity to try questions repeatedly, watch a video, or receive hints.
Physics Classroom
The Physics Classroom: 1 D Kinematics: Meaning of Slope for a v T Graph
In this part of a physics lesson, examine how the actual slope value of any straight line on a velocity-time graph is the acceleration of the object.
Integrated Publishing
Integrated Publishing: Equation of a Straight Line
This math tutorial shows the relationship of a slope to a straight line and how to write equations in point-slope or slope-intercept form.
Illustrative Mathematics
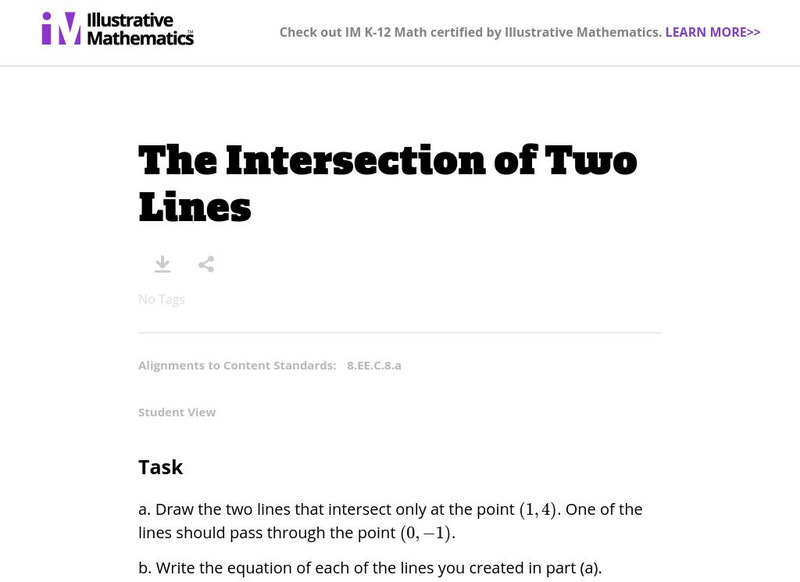
Illustrative Mathematics: The Intersection of Two Lines
The purpose of this task is to introduce students to systems of equations. It takes skills and concepts that students know up to this point, such as writing the equation of a given line, and uses it to introduce the idea that the...
Shodor Education Foundation
Shodor Interactivate: Lesson: Graphs and Functions
This lesson plan is directed at introducing young scholars to how to graph functions on the Cartesian coordinate plane. They will experience several categories of functions including lines and parabolas. Resources and interactive tools...
CK-12 Foundation
Ck 12: 3.3 Inverse Functions
This section explores the process for finding inverses of functions, and then proving the function and its inverse algebraically. Additionally, it explores how the graphs of functions and their inverses compare to each other, and it...
TeachEngineering
Teach Engineering: Graphing the Rainbow
Students are introduced to different ways of displaying visual spectra, including colored "barcode" spectra, like those produced by a diffraction grating, and line plots displaying intensity versus color, or wavelength. Students learn...
OpenStax
Open Stax: Graphical Analysis of One Dimensional Motion
In the following interactive module students will describe a straight-line graph in terms of its slope and y-intercept. They will determine average velocity or instantaneous velocity from a graph of position vs. time.
EL Education
El Education: A Field Guide to East Bog Swamp
This micro-field guide was created by 5th and 6th graders in Marlboro, Vermont. Groups of 3 or 4 students worked together to investigate their own 3 by 3 foot research plot, over multiple visits, and then created a field guide to their...
Council for Economic Education
Econ Ed Link: Who Is Working?
This lesson teaches students what economists mean when they talk about people who are employed, unemployed, and not in the labor force. It discusses the Current Population Survey and asks students to pose as government survey workers to...
Other popular searches
- Line Graphs
- Double Line Graphs
- Bar and Line Graphs
- Line Pie Bar Graph
- Interpreting Line Graphs
- Line Plot Graphs
- Making Line Graphs
- Reading Line Graphs
- Analyzing Line Graphs
- Creating Line Graphs
- Number Line Graphs
- Reading Double Line Graphs


