Beacon Learning Center
Beacon Learning Center: Interpreting Line Graphs
This site is a lesson on creating and interpreting a line graph. It explains how a line graph is created and then asks questions about what is learned from the data. Students type in open responses, and answers and feedback follow.
PBS
Pbs Learning Media: Curious George Stem: Graphing Lesson Plan
A hands-on lesson plan where students compare and analyze data from their graphs.
Government of Alberta
Learn Alberta: Math Interactives: Exploring Data Display and Graphs
This multimedia Learn Alberta math resource focuses on graphing data. In the video portion, students will see how math is involved in the display of merchandise in stores. The accompanying interactive component provides an exploration...
That Quiz
That Quiz: Practice Test: Graphs
This resource allows users to test their knowledge of graphs and graphing methods.
ClassFlow
Class Flow: Data Analysis Using Graphing
[Free Registration/Login Required] This flipchart allows students to analyze data using appropriate graphs, including pictographs, histograms, bar graphs, line graphs, circle graphs, and line plots introduced earlier, and using...
Sophia Learning
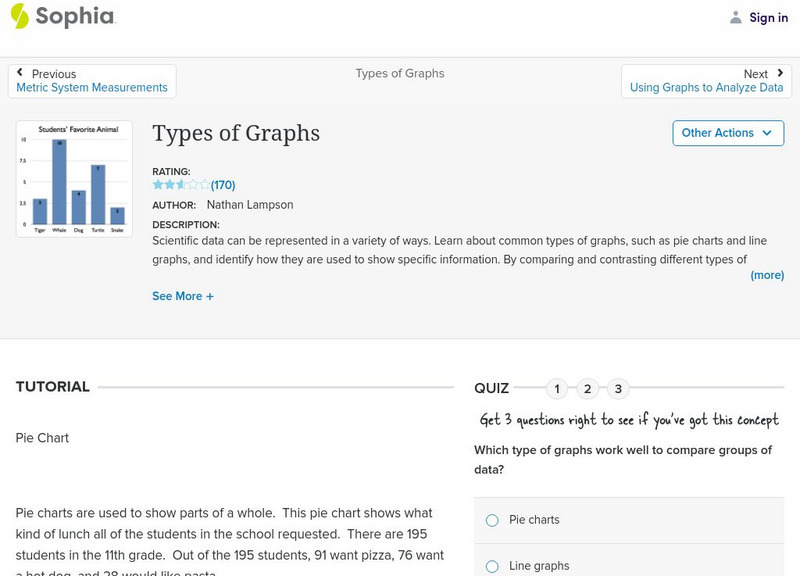
Sophia: Types of Graphs
This presentation allows the learner to visualize the different types of graphs used to display data in scientific investigations.
National Council of Teachers of Mathematics
The Math Forum: Lines and Slope: Chameleon Graphing
Join Joan the chameleon in an exploration of lines and slope. You'll be drawing lines, calculating slope, using equations and more!
National Council of Teachers of Mathematics
The Math Forum: Chameleon Graphing: Coordinate Plane
Dive into this introduction to graphing in the coordinate plane, and meet a chameleon named Sam. Sam will help guide you through graphing points on a line, using negative numbers, and graphing points in the coordinate plane.
NASA
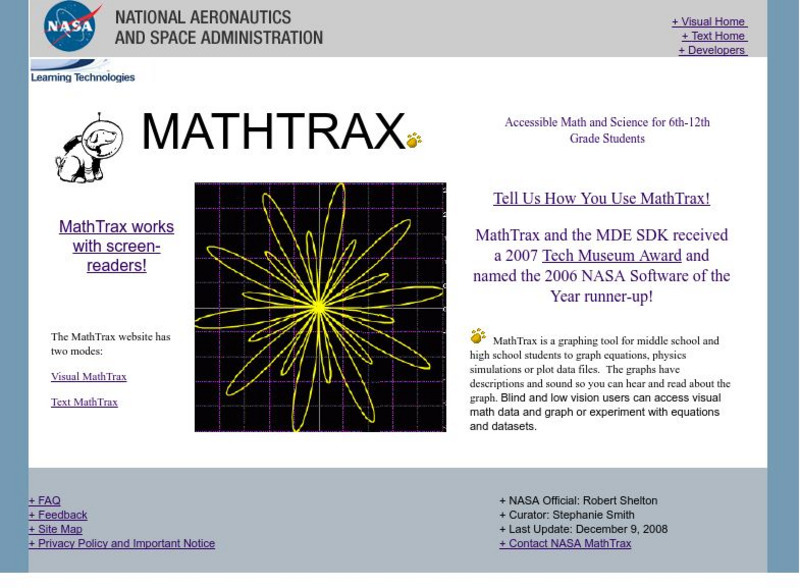
Nasa: Mathtrax Graphing Tool
NASA: Mathtrax is a graphing tool where the graphs includes descriptions and sounds. It is also adaptable for students who have visual accomidations.
E-learning for Kids
E Learning for Kids: Math: Wizards: Graphs
Join the Magic Wandia Games and learn all about graphs!
McGraw Hill
Glencoe: Self Check Quizzes 1 Using Bar and Line Graphs
Use Glencoe's randomly generated self-checking quiz to test your knowledge of using bar and line graphs. Each question has a "Hint" link to help. Choose the correct answer for each problem. At the bottom of the page click the "Check It"...
Math Is Fun
Math Is Fun: Data Graphs
Create and customize a bar graph, line graph, or pie chart based on a set of data and print it out.
University of Illinois
University of Illinois: Line Graphs
Line graphs are shown and explained here. You can learn what kind of data is best represented using a line graph. There are also line graphs with questions and answers available to help you learn how to read them.
Mangahigh
Mangahigh: Data: Using Line Graphs
This site provides students practice with the concept of line graphs. Students can learn about the topic by completing an interactive tutorial. Students can then take a ten question timed test to practice the skill.
Mangahigh
Mangahigh: Algebra: Recognize Common Straight Line Graphs
Mangahigh is a website with math games aimed at twelve to eighteen year olds. On this site students draw and recognize lines without the need to construct a table of values.
Mangahigh
Mangahigh: Algebra: Draw Straight Line Graphs
Mangahigh is a website with math games aimed at twelve to eighteen year olds. On this site students plot graphs of explicit linear functions.
Mangahigh
Mangahigh: Algebra: Draw Straight Line Graphs Using Y = Mx + B
Students watch an online tutorial on the concept of graphing using slope intercept form. After watching, students test their knowledge by attempting ten practice problems that increase or decrease in difficulty based on their answers.
Better Lesson
Better Lesson: Graphing Our Snack Mix: Review of Graphing
Second graders review how to make bar graphs, line plots, and pictographs by tallying the contents of snack mix and building graphs to show their data.
US Department of Education
Nces Kids: Creating an Area Graph
This is where you will find step by step directions explaining how to create an area graph. Complete each step and click on the next tab. Directions are simple and clear.
CK-12 Foundation
Ck 12: Graphing
[Free Registration/Login may be required to access all resource tools.] Given a set of data, students will understand how to correctly draw a line or bar graph, interpret its patterns, and find the slope in the case of a line graph.
TeachEngineering
Teach Engineering: A Lego Introduction to Graphing
Students use a LEGO ball shooter to demonstrate and analyze the motion of a projectile through use of a line graph. This activity involves using a method of data organization and trend observation with respect to dynamic experimentation...
McGraw Hill
Glencoe: Self Check Quizzes 1 Analyzing Graphs
Use Glencoe's randomly generated self-checking quiz to test your knowledge of how to analyze graphs. Each question has a "Hint" link to help. Choose the correct answer for each problem. At the bottom of the page click the "Check It"...
Other
Online Statistics Education: Graphing Distributions [Pdf]
This is the second chapter of a statistics e-text developed collaboratively by Rice University, University of Houston Clear Lake, and Tufts University. It looks at many different types of data displays and the advantages and...
US Department of Education
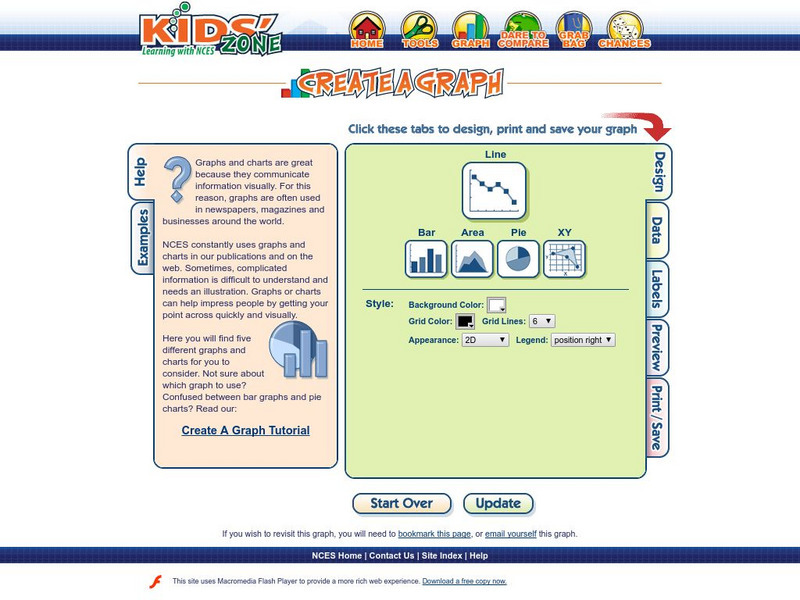
Nces: Create a Graph: Line Graph
This resource from the National Center for Education Statistics provides tools for creating line graphs right online! Select a type of graph, fill in the information, and voila! -- you have created a wonderful graph all your own!
Other popular searches
- Line Graphs
- Double Line Graphs
- Bar and Line Graphs
- Line Pie Bar Graph
- Interpreting Line Graphs
- Line Plot Graphs
- Making Line Graphs
- Reading Line Graphs
- Analyzing Line Graphs
- Creating Line Graphs
- Number Line Graphs
- Reading Double Line Graphs


