Curated OER
Would You Like to Become a Millionaire?
Students answer questions written by other teams about literature in an attempt to become "millionaires." In small groups they write a motivational introduction to their teams selected books, publish their questions as a HyperCard...
Curated OER
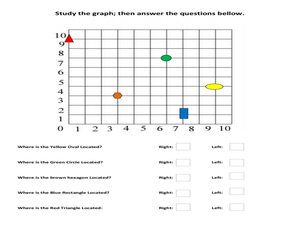
Graph Study
In this geometry skills worksheet, students examine a graph and respond to 5 questions that require them to identify the coordinate pairs of object on the grid.
Curated OER
Student Costs Graph
Students calculate the mileage, gasoline costs, and travel time and costs for a vacation. They conduct a virtual field trip, and create a comparison graph of costs using Microsoft Excel software.
Curated OER
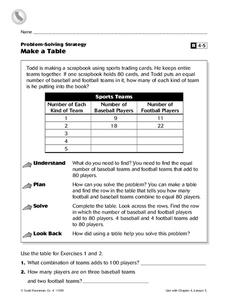
Make a Table
In this charting worksheet, 4th graders complete a table. Using the information provided, students fill in the missing data and complete 2 short answer questions.
Mathed Up!
Cumulative Frequency and Box Plots
Learn how to display data. Young data analysts watch a video to review how to create cumulative frequency histograms and box plots. They work on a set of questions to practice producing these data displays.
Mathed Up!
Histograms
Class members explore how to read and use histograms by watching a video on creating and analyzing histograms. To finish, the class works on a set of questions that tests these skills.
Curated OER
Fitting a Line to Data
High schoolers work together in groups to collect data in relationship to how much water marbles can displace. After the experiment, they use the data to identify the linear equation to determine the best-fit line. They use the...
Curated OER
Regents High School Examination: Mathematics B
For this algebra, graphing, and geometry exam worksheet, 12th graders complete 34 math problems. The skills for each question cover a variety of topics, and graphing on grid paper is required for some of the questions.
Curated OER
Freshman Project-Part 5
In this project worksheet, 9th graders display their data, the make a graph and they answer analysis and conclusion questions on their experimental design project. They discuss the variables of their experiment, their major findings,...
Curated OER
Storybook Character Graph
First graders dress as their favorite storybook character. They draw a self-portrait, then place the drawing on a graph.
Curated OER
Data Analysis and Probability
Students make their own puzzle grid that illustrates the number of sit-ups students in a gym class did in one minute, then they make a histogram for this same data. Then they title their graph and label the scales and axes and graph the...
Curated OER
Give Me A Break!
Students create and conduct a survey. In this broken bones lesson, students discuss if they've ever broken a bone and how a broken bone heals. Students generate questions for a survey on broken bones and healing time, conduct the survey...
Curated OER
Gummy Bear Math
First graders predict, collect data, and create a graph based on gummy bear colors they are given. In this graphing lesson plan, 1st graders first predict how many colors of gummy bears there are. They then count the colors, graph them,...
Curated OER
M & M Madness
Students work with the mathematics unit of collection, organization, and presentation of data. In this math and technology lesson plan, students use Valentine M & M’s and The Graph Club to sort and graph the various colored M & M’s.
Curated OER
Eat Your Veggies
Students investigate displaying data. In this displaying data lesson plan, students use tallies to count data about food preferences. Students use various types of graphs such as bar graphs, picture graphs, box-and-whisker plots, etc...
Curated OER
Then and Now
Students conduct research and use census data to compare different times and places. For this census lesson, students interpret data from charts and graphs, comparing census information from two time periods as well as from two...
Curated OER
Graphing Lines
In this algebra worksheet, 9th graders are given a linear equation and asked to graph the lines. There are 12 questions with an answer key.
Curated OER
Graphing Radicals
In this algebra worksheet, students find the domain and range of radical functions. They are given an equation and asked to graph the function. There are 14 questions on this worksheet, with an answer key.
Curated OER
Probability Using M&M's
Students estimate and then count the number of each color of M&M's in their bag. In this mathematics lesson, students find the experimental probability of selecting each color from the bag. Students create pictographs and bar graphs...
Curated OER
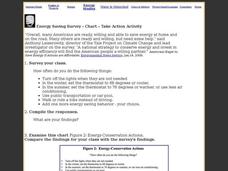
Energy Saving Survey - Chart - Take Action Activity
In this saving energy worksheet, students survey the class about saving energy, examine an energy chart, and answer short answer questions. Students complete 4 tasks.
Pennsylvania Department of Education
Freckle Face
Students collect and record data. In this early data analysis lesson, students gather data about their partners face. As a class, the students use tally marks and pictographs to record the data and answer question about the information...
Curated OER
Scatter Graphs
In this scatter graphs activity, students learn a way of illustrating information about two related values. Students complete 30 questions about the graphs. Note: One of the graphs has English pounds. This is intended as an online...
Curated OER
More on Limits, Graph Sketching, and L'Hopital's Rule
In this limits worksheet, students compute the answers to thirteen limits problems. They answer one short answer question. Students follow listed steps to simplify two limits problems. Students answer three short answer questions about a...
Curated OER
An Immigration Graph
Students practice reading and understanding information in a table and converting the information to graph form. They create a graph showing the number of immigrants per country of origin between 1899 and 1924.


