Federal Reserve Bank
Measuring the Great Depression
Young historians examine the cost of goods and services through the Consumer Price Index (CPI), output measured by Gross Domestic Product (GDP), and unemployment measured by the unemployment rate to gain an understanding of the economic...
Teach Engineering
Preconditioning Balloons: Viscoelastic Biomedical Experiments
What does stretching a balloon have to do with equilibrium? Groups explore preconditioning by stretching a balloon to a point of equilibrium. They then measure the amount of force required to stretch the balloon to the same point several...
Achieve
BMI Calculations
Obesity is a worldwide concern. Using survey results, learners compare local BMI statistics to celebrity BMI statistics. Scholars create box plots of the data, make observations about the shape and spread of the data, and examine the...
Curated OER
Problem Solving 1
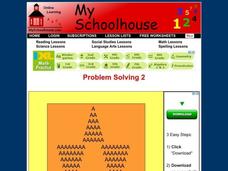
In this online interactive problem solving worksheet, students examine a diagram and use their problem solving skills in order to respond to 5 questions.
Curated OER
Histograms
In this histograms worksheet, students solve 5 word problems based on a histogram of presidential ages at their inauguration. Next, students create a frequency table and a histogram based on a list of data which shows the average...
Curated OER
Guess the Ages
Learners explore scatter plots in this algebra lesson. They create a scatter plot from their guesses regarding a famous person’s birth date and the actual birth date then they examine and interpret the results of their graph.
Curated OER
Functions
In this functions worksheet, 11th graders solve and complete 30 various types of multiple choice problems that include reading and interpreting functions and patterns. First, they determine the table that best represents a function....
Curated OER
The Shortest Line Mystery
Students calculate the shortest distance of various scenarios. In this algebra lesson, students interpret graphs of optimization problems. They use a graphing calculator to assist them in graphing and making predictions.
Curated OER
Favorite Animal at the Zoo - Making a Pie Chart
In this graphing and interpretation worksheet set, students draw charts that are either blank or outlined that show information about students' favorite zoo animals. They answer questions based on the data in 15 examples.
Curated OER
Don't Lose Your Load!
Students create graphs using collected data. In this algebra lesson, students use spreadsheet in Excel to create graphs to interpret their data and make predictions. They rewrite word problems using algebraic expressions.
Curated OER
The Treasure Map
Third graders problem solve using drawings and map interpretations. They preview graphs and Cartesian geometry. They follow directions on a map using a grid and compass references while simulating they are reading a pirate map.
Curated OER
Valentine Candy Count
Young scholars investigate what color Valentine Candy is found more often than any other in a standard bag of "Valentine Conversation Hearts." They sort, classify and graph their findings.
Curated OER
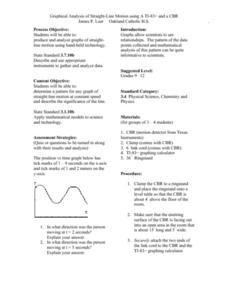
Graphical Analysis of Straight-Line Motion
Students investigate the concept of straight line motion. They determine the pattern and graph it looking for the motion maintained at a constant speed. Students also write a description of the significance of the line. The skill of...
Curated OER
How Many Cells Are Born in a Day?
Students predict the number of cells after a series of cell divisions. In this cells lesson students create a graph of their results and create a patterned drawing.
Curated OER
Hopes and Dreams: A Spreadsheet Lesson Using Excel
Fourth graders read "The Far Away Drawer" by Harriet Diller and discuss the story as a class. After discussion, 4th graders create a t-shirt GLYPH about their hopes and dreams,share their information with the class and create spreadsheets.
Curated OER
Bar Me In
Fourth graders watch a video about constructing bar graphs. They create their own graph and interpret it.
Curated OER
Hurricanes in History:
Students interpret data displayed in a graph, make inferences based on graphical data. They work in pairs or groups to interpret graphs containing historical data of hurricanes, and then answer questions that assess their understanding...
Curated OER
The Workers
Students observe the axis of a graph on the board and add the title and axis labels. They plot two points on the graph and join the two with a line and work to describe the story in each of the graphs.
Curated OER
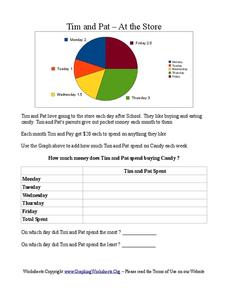
Tim and Pat - At the Store
For this pie chart worksheet, students use the pie chart to add the amount of time Tim and Pat spend buying candy each day of the week. Students answer 2 questions about the table.
Curated OER
Cindy and Linda - Selling Lemonade
In this pie charts worksheet, students use the pie chart to count how many glasses of Lemonade were sold by Cindy and Linda. Students complete the table and answer 3 questions.
Curated OER
Instantaneous Rate of Change of a Function
Pupils draw the graph of a door opening and closing over time. They graph a given function on their calculators, create a table of values and interpret the results by telling if the door is opening or closing and evaluate the average...
Curated OER
Read and Write Numbers up to 100,000
Use this lengthy, and challenging, presentation in your lesson on numeracy. Pupils practice their skills in reading and writing numbers up to 100,000, interpret a variety of graphs, solve word problems, and get to use a calculator. A...
eGFI
Design a Green Rooftop Garden
Design and construct buildings with rooftop gardens. Junior engineers work in groups to build two buildings and then perform experiments to determine whether or not a garden affects the building's temperatures. They graph and interpret...
National Wildlife Federation
Wherefore Art Thou, Albedo?
In the sixth lesson in a series of 21, scholars use NASA data to graph and interpret albedo seasonally and over the course of multiple years. This allows learners to compare albedo trends to changes in sea ice with connections to the...
Other popular searches
- Interpret Charts and Graphs
- Interpreting Bar Graphs
- Interpreting Line Graphs
- Interpreting Circle Graphs
- Interpret Graphs
- Reading Graphs and Charts
- Graphs Interpreting Data
- Bar Graph Interpretation
- Reading Graphs in Science
- Timed Reading Graphs
- Interpreting Graphs Algebra
- Math Interpreting Bar Graphs


