Curated OER
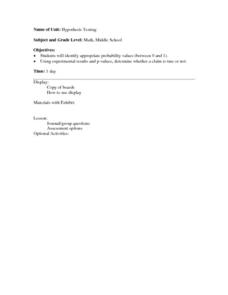
Hypothesis Testing
Students investigate the finding of a hypothesis and how it can be tested.For the experiment they will be using the concept of probability. Students design an experiment and test the hypothesis. Then the results are graphed showing the...
Curated OER
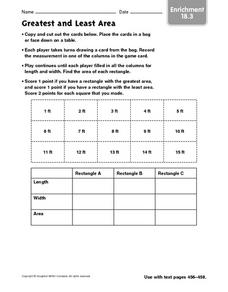
Greatest and Least Area - Enrichment 18.3
In this greatest and least area game activity, students cut out the cards, draw a card and record the measurement in the length or width column of a graph. When all columns have been filled, they calculate the areas to find the winner...
Curated OER
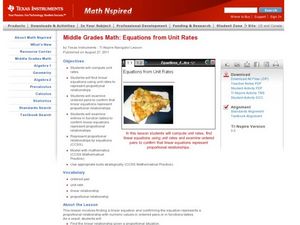
Equations from Unit Rates
Your class can become linear equations masters, as they calculate the rate of change of a function. They observe different types of coordinates as they relate to a graph, then use the Ti-navigator to move the line around and draw...
Curated OER
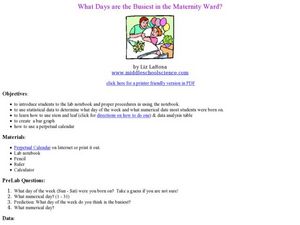
What Days Are the Busiest in the Maternity Ward?
Students form a conclusion using statistical data. In this statistical data lesson, students collect and analysis data to form a conclusion about what day of the week most babies are born.
Curated OER
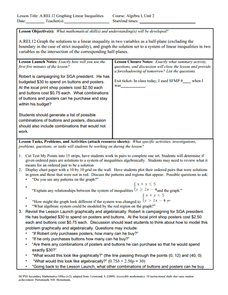
Graphing Linear Inequalities
Eighth graders extend skills for representing and solving linear equations to linear inequalities. Lesson activities build understanding and skill by plotting ordered pairs of numbers that either satisfy or do not satisfy a given...
Curated OER
Our Favorites
Learners participate in and conduct a survey to determine various class favorites. They collect, organize and display their data, interpret the results, and complete a packet of worksheets to display the information.
Curated OER
2 X 2 Linear Systems
Learners solve 2 X 2 systems graphically and algebraically. They investigate parallel systems. They solve application problems using 2 X 2 systems.
Alabama Learning Exchange
Scaling Down the Solar System
Learners work collaboratively to gain a better understanding of the vastness of space by scaling down the solar system. They measure by inches, gain an understanding of space, and model the distances of the planets from the sun.
Curated OER
Variation
In this variation activity, students interpret and organize data. They find the distance between points. Students use ratios to determine volume This six-page activity contains approximately 20 problems. Answers are provided on the...
Curated OER
Populations Lab - Exponential Graphing
Ninth graders investigate the application of populations that exists in one's everyday environment, in order to develop an understanding of how mathematics is a key component in the understanding of population dynamics.
Curated OER
Diagnosing Allergies Through Data Collection
Students research and organize information about allergies. In this data collection instructional activity, students watch a video about allergies. Students create a histogram using the information collected. Students complete the...
Curated OER
Organizing and Interpreting Data
In this organizing and interpreting data worksheet, students solve and complete 10 different problems related to reading various data tables. First, they complete the 3 charts shown with the correct tally amount, frequency amount, and...
Curated OER
Data Handling: Pictogram of Birds
In this pictograph problem solving learning exercise, students analyze a pictograph of birds seen each day for a week. They use the information on the graph to solve 6 problems.
Curated OER
Using Representations to Model Problems
student make predictions or draw conclusions based on physical and visual representations of profit and sales. They model problems with physical materials and visual representations, and use models, graphs and tables to draw conclusions...
Curated OER
Plotting Wind Speed and Altitude
Students construct, read and interpret tables, charts and graphs. They draw inferences and develop convincing arguments that are based on data analysis. They create a graph displaying altitude versus wind speed.
Curated OER
French Fry Fun: Estimating and Measuring
Third graders demonstrate their estimating and measuring abilities. In this length measurement lesson, 3rd graders produce estimates of how long a handful of French fries will be before physically measuring them. Students graph their...
Curated OER
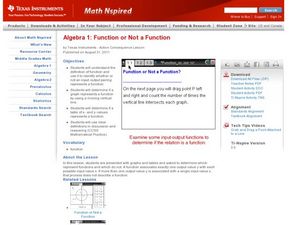
Function or Not a Function
Graphing linear equations on the TI is easy! Through examination of graphs and identification if it is a function or not, this lesson can relate to the real world.
Curated OER
Global Statistics
Students determine statistics based on data. In this statistics lesson, students use data and record in charts. Students create graphs based on the statistics found.
Curated OER
Interpreting Data and Building Hypothesis
Students define the term species, and graph species data together with previously collected data at the National Zoo. They interpret graphed data and recognize patterns in the streamside quadrant versus hillside quadrant. Students use...
Curated OER
Why Would I Owe My Soul to the Company Store?
Sixth graders listen to "Sixteen Tons" by Tennessee Ernie Ford and discuss what it means to owe one's soul to a store. In this mathematics lesson, 6th graders determine what a miner's income was minus his expenses graphing findings in a...
Curated OER
Pumped Up Gas Prices
Students calculate gas prices. In this transportation lesson plan, students tally the mileage and gas costs of their car for one months. They figure out how much was spent on gas and create a graph showing average gas prices over time.
Curated OER
You Gotta Have Heart
Ninth graders investigate the concept of relations and interpret graphs and tables. They analyze given data and look for a pattern to determine if the numbers represent a function. Students practice solving scientific word problems that...
Curated OER
Voter Turnout
Students solve problems using math. They complete a graph, using data from the 2000 presidential election results. Students predict and calculate the outcome of the election based upon the voting patterns.
Other popular searches
- Tables, Charts and Graphs
- Function Tables and Graphs
- Tables and Graphs
- Tables Charts and Graphs
- Create Data Tables From Graphs
- Math Tables and Graphs
- Reading Tables and Graphs
- Data Displays and Graphs
- Tables, Graphs, Charts
- Using Graphs and Tables
- Making Tables and Graphs
- Data Tables and Graphs


