Hi, what do you want to do?
Texas Instruments
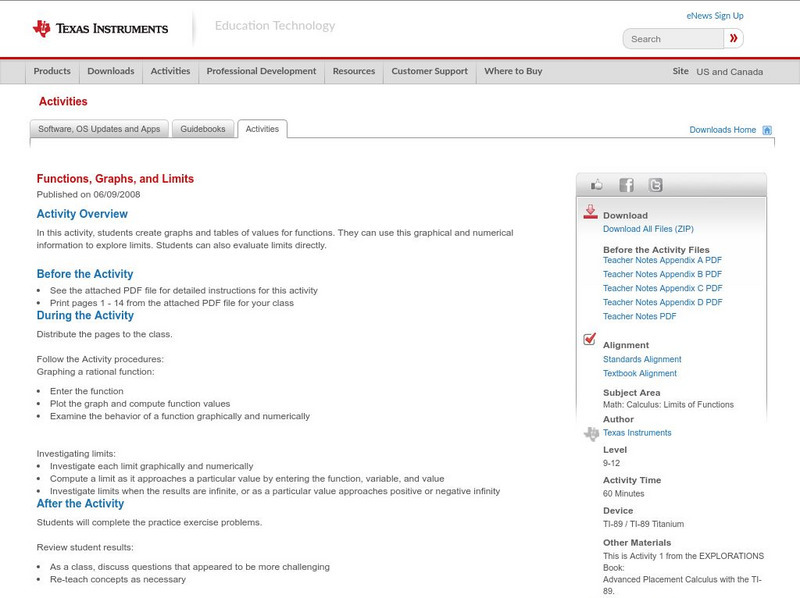
Texas Instruments: Functions, Graphs, and Limits
In this activity, students create graphs and tables of values for functions. They can use this graphical and numerical information to explore limits. Students can also evaluate limits directly.
Texas Education Agency
Texas Gateway: Connecting Multiple Representations of Functions
The student will consider multiple representations of linear functions, including tables, mapping diagrams, graphs, and verbal descriptions.
Other
Nearpod: Graphing Equations Using a Table
In this lesson on graphing equations using a table, young scholars will learn how to create a table for a function in terms of domain and range and then graph the function on the coordinate plane.
Texas Education Agency
Texas Gateway: Functions and Their Inverses
Given a functional relationship in a variety of representations (table, graph, mapping diagram, equation, or verbal form), the student will determine the inverse of the function.
Texas Education Agency
Texas Gateway: Direct Variation and Proportional Change
The student will use a variety of methods inculding tables, equations and graphs to find the constant of variation and missing values when given a relationship that varies directly.
CK-12 Foundation
Ck 12: Algebra: Graphs of Linear Equations
[Free Registration/Login may be required to access all resource tools.] Students learn how to graph linear equations. Students examine guided notes, review guided practice, watch instructional videos and attempt practice problems.
CK-12 Foundation
Ck 12: Algebra: Input Output Tables for Function Rules
[Free Registration/Login may be required to access all resource tools.] Evaluate a function rule by finding outputs for a given input
Texas Instruments
Texas Instruments: C Ds Anyone?
In this activity, students write rules for real world functions. They make a table to compare function values and graph linear functions on the coordinate plane.
CK-12 Foundation
Ck 12: Algebra: Functions on a Cartesian Plane
[Free Registration/Login may be required to access all resource tools.] Students learn to graph a function represented by a table of values in the coordinate plane. Students examine guided notes, review guided practice, watch...
Khan Academy
Khan Academy: Algebra I: Exponential Functions From Tables & Graphs
Write exponential functions of the basic form f(x)=a * b squared, either when given a table with two input-output pairs, or when given the graph of the function. Students receive immediate feedback and have the opportunity to try...
Khan Academy
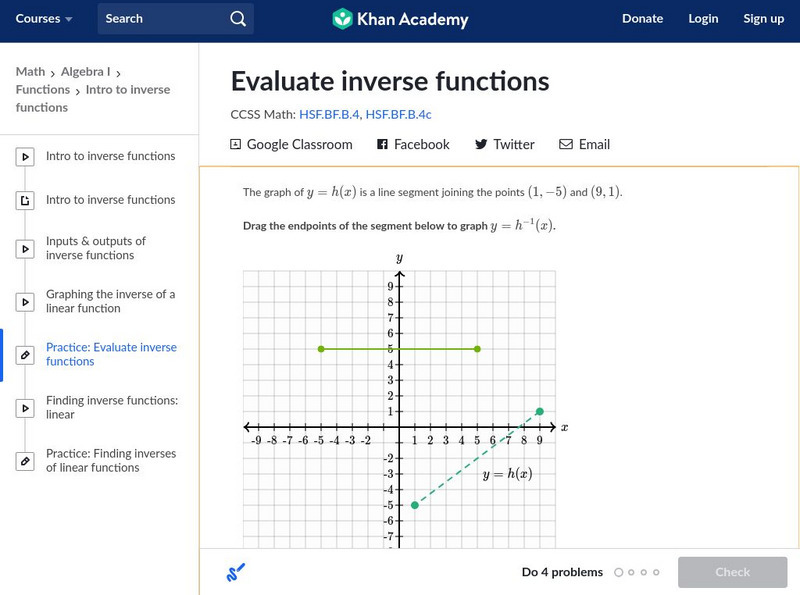
Khan Academy: Algebra I: Evaluate Inverse Functions
Practice evaluating the inverse function of a function that is given either as a formula, or as a graph, or as a table of values. Students receive immediate feedback and have the opportunity to try questions repeatedly, watch a video or...
CK-12 Foundation
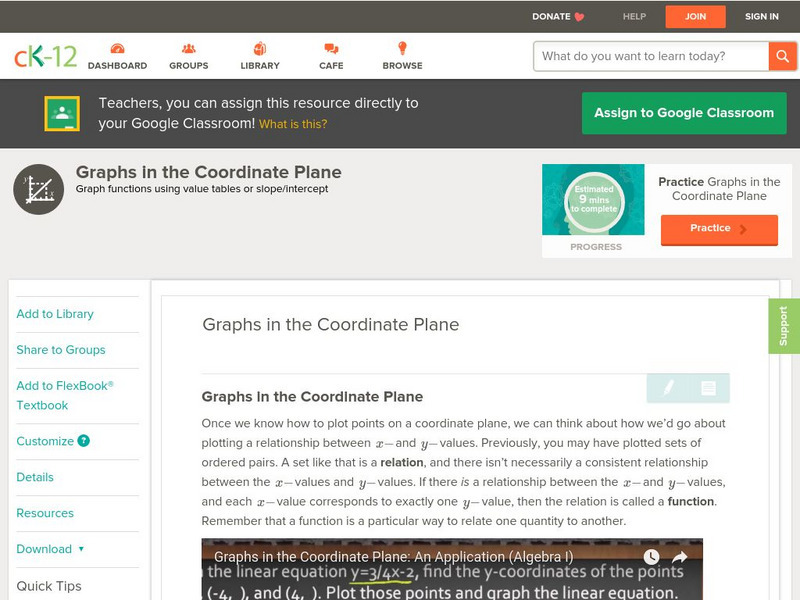
Ck 12: Algebra: Graphs in the Coordinate Plane
[Free Registration/Login may be required to access all resource tools.] Students learn to use tables of values and rules to graph functions. Students examine guided notes, review guided practice, watch instructional videos and attempt...
Sophia Learning
Sophia: Graphing Square Root Function
Create a table of values to graph a square root function and identify the domain and the range.
Alabama Learning Exchange
Alex: Math Is Functional
This lesson is a technology-based activity in which students extend graphing of linear functions to the use of spreadsheet software. After students have become proficient in constructing a table of values, students are able to...
Other
Limits a Geometric and Numeric Approach
Students learn about limits using geometric and numeric approaches. Topics include limits using tables and limits with graphs. The resource consists of graphs, examples, and a learning game.
Mangahigh
Mangahigh: Algebra: Recognize Common Straight Line Graphs
Mangahigh is a website with math games aimed at twelve to eighteen year olds. On this site students draw and recognize lines without the need to construct a table of values.
ClassFlow
Class Flow: Three Views of a Function
[Free Registration/Login Required] Using this flipchart, students will graph a function and create a table from a rule and a graph.
California State University
California State University, San Bernardino: Inverse Functions
This site has many links to examples of inverse functions, including intersections, inverse by reflection, and graphing inverse functions.
ClassFlow
Class Flow: Graphing Inequalities
[Free Registration/Login Required] Students represent functional relationships using tables, equations, and graphs, and describe the connection among these representations.
CK-12 Foundation
Ck 12: Using the First and Second Derivative Tests
[Free Registration/Login may be required to access all resource tools.] This resource gives a step by step account of how to apply knowledge from First and Second Derivative Tests to sketch graphs of functions. The following table...
Texas Instruments
Texas Instruments: Understanding Limits
This activity is designed to show students how to use a graphing calculator to find a limit by graphing, investigating a table, and by using the calc menu. (Continued. See "before the activity.")
Khan Academy
Khan Academy: Rates and Proportional Relationships
A variety of questions about rates and proportional relationships involving graphs, tables, and equations. Students receive immediate feedback and have the opportunity to try questions repeatedly, watch a video, or receive hints.
Khan Academy
Khan Academy: Intercepts From a Table
Find the intercepts of a line given a table of values. Students receive immediate feedback and have the opportunity to try questions repeatedly, watch a video, or receive hints.
Texas Instruments
Texas Instruments: Social Security Issues
In this activity, you will look at the relationship between the age at which you start drawing social security and the amount drawn. Both graphs and spreadsheets will be used.


