Hi, what do you want to do?
Curated OER
Weather Watchers
First graders study changes in daily weather conditions. They explore weather pattern consistency.
Curated OER
Is Charleston Your Lucky Charm?
Students determine what makes Charleston, West Virginia unique. In this West Virginia history lesson, students explore the West Virginia History Museum to identify why Charleston became the capitol of the state.
Curated OER
A Bird's Eye View of our 50 States
Third graders focus on state birds as they learned absolute location (latitude/longitude) of each state, as well as their relative location (bordering states).
Curated OER
Investigation of Timbre
Students design an experiment to analyze the timbre of different instruments. In this physics lesson, students analyze the missing quality in sound. They discuss their results in class.
Curated OER
American Political Thought: Minority Influence
Sixth graders brainstorm the reasons why people would want to leave their homeland to live in the United States. In groups, they research the political representation of the Board in New Haven, Connecticut. They also write a paper on...
Curated OER
Cinderbank
Fourth graders identify major components of a "Cinderella" story in order to create a database.
Shodor Education Foundation
Shodor Interactivate: Comparison of Univariate and Bivariate Data
Young scholars learn about the difference between univariate and bivariate data and understand how to choose the best graph to display the data.
Better Lesson
Better Lesson: Graph Party
First graders will be involved in creating three different types of graphs and then be asked to answer questions about each representations data set.
Other
Bscs: Frog Symphony
In this self-directed instructional activity, students use maps and graphs of data to investigate the habitats and time of year and day to hear a full chorus of frogs. A handout with everything the student needs to complete this...
Better Lesson
Better Lesson: Line Graph Activity
Data collected is represented in tables and the students will need to choose what they want to represent in their line graph.
Education Place
Houghton Mifflin: Eduplace: Make a Living Bar Graph
Student use simple data to line up in a living bar graph activity when they respond to simple questions in this lesson plan. They physically and visually represent the data. CCSS.Math.Content.3.MD.B.3 Draw a scaled picture graph and a...
PBS
Wnet: Thirteen: Ed Online: Growing, Growing, Graphing!
Students explore the growth population of China and use graphs and equations to display data.
PBS
Pbs Mathline: Button, Button Lesson Plan [Pdf]
An integrated math and language arts lesson focusing on statistics. Students explore the concepts of estimation, data collection, data analysis, classification, graphing, and counting through the reading of the Button Box by Margarette...
University of Texas at Austin
Mathematics Teks Toolkit: And We Go Around
Collect and display data using a bar and circle graph to explore fractions and percents.
Alabama Learning Exchange
Alex: Get on Your Mark, Get Set, Go!
In collaborative/cooperative groups, young scholars will review basic vocabulary and concepts for data and statistics. Students will create, collect, display, and interpret data in the form of frequency tables, bar graphs and circle graphs.
Better Lesson
Better Lesson: Graphing Using a Frequency Table
Multiple graphs can represent the same data set and make the information easier to understand.
Howard Hughes Medical Institute
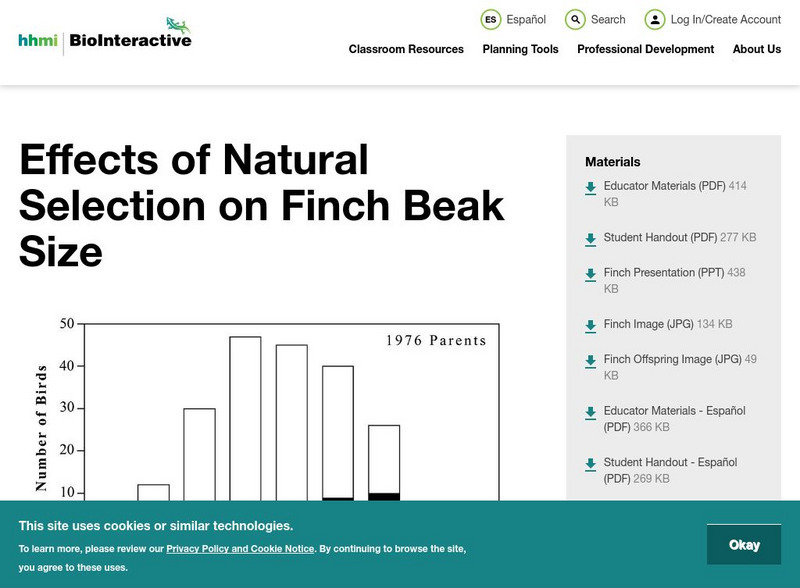
Hhmi: Bio Interactive: Effects of Natural Selection on Finch Beak Size
In this activity, students examine research on finches on the island of Daphne Major in the Galapagos Islands. The depth of the finches' beaks was measured before and after a drought. This data is displayed in graphs and students are...
BSCS Science Learning
Bscs: Frog Eat Frog World
Using maps and graphs of large data sets collected in FrogWatch, middle schoolers will determine the range, preferred land cover, and proximity to water of the American bullfrog to figure out the bullfrog's requirements for food, water,...
Science Education Resource Center at Carleton College
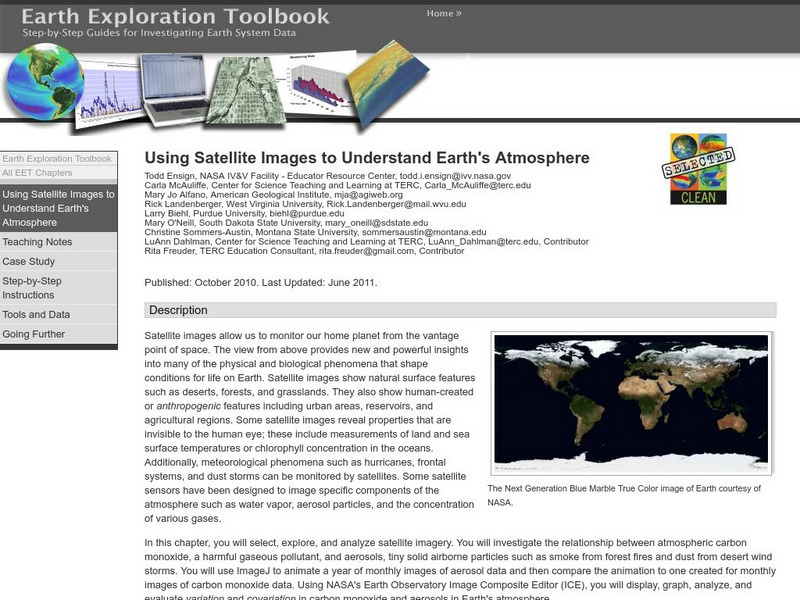
Serc: Using Satellite Images to Understand Earth's Atmosphere
This lesson helps students select, explore, and analyze satellite imagery. Students investigate the relationship between atmospheric carbon monoxide and aerosols. Incorporate ImageJ to animate a year of monthly images of aerosol data and...
Alabama Learning Exchange
Alex: "Bursting With Math"
Using "Starburst" jelly beans to sort, graph and add.
Alabama Learning Exchange
Alex: Who Bounces Best?
This is a cooperative learning, kinesthetic and presentation lesson. Students will use the computer to create graphs/charts to display data collected by counting the number of successful bounces when bouncing a basketball for 30 seconds....
Better Lesson
Better Lesson: What Is Your Favorite Pet?
SWBAT create a bar graph to match a data set. SWBAT analyze the graph to find 3 pieces of information the graph shows them.
Better Lesson
Better Lesson: What Is Your Favorite Little Bear Story?
SWBAT create a bar graph to match a data set. SWBAT analyze the graph for 3 pieces of information.


