PBS
Pbs Kids Afterschool Adventure!: Operation: Data Saves the Day Activity Plan
Data comes to the rescue! Children will collect, analyze, and represent data as they try to dodge a series of catastrophes faced by characters from their favorite PBS Kids shows.
Better Lesson
Better Lesson: Jumping Into Math, Measurement, & Data Day 1
Third graders apply measurement, graphing, and data skills to the real world context of physical education with standing jumps.
Next Gen Personal Finance
Next Gen Personal Finance: Managing Credit Data Crunch
Data Crunches feature one chart or graph followed by five scaffolded questions to guide students through analyzing the data and drawing conclusions. These sets of data help students understand financial concepts.
Next Gen Personal Finance
Next Gen Personal Finance: Saving Data Crunch
Data Crunches feature one chart or graph followed by five scaffolded questions to guide students through analyzing the data and drawing conclusions. These sets of data help students understand financial concepts.
Next Gen Personal Finance
Next Gen Personal Finance: Checking Data Crunch
Data Crunches feature one chart or graph followed by five scaffolded questions to guide students through analyzing the data and drawing conclusions. These sets of data help students understand financial concepts.
Next Gen Personal Finance
Next Gen Personal Finance: Career Data Crunch
Data Crunches feature one chart or graph followed by five scaffolded questions to guide students through analyzing the data and drawing conclusions. These sets of data help students understand career concepts.
Next Gen Personal Finance
Next Gen Personal Finance: Insurance Data Crunch
Data Crunches feature one chart or graph followed by five scaffolded questions to guide students through analyzing the data and drawing conclusions. These sets of data help students understand insurance concepts.
Next Gen Personal Finance
Next Gen Personal Finance: Taxes Data Crunch
Data Crunches feature one chart or graph followed by five scaffolded questions to guide students through analyzing the data and drawing conclusions. These sets of data help students understand tax concepts.
Next Gen Personal Finance
Next Gen Personal Finance: Financial Pitfalls Data Crunch
Data Crunches feature one chart or graph followed by five scaffolded questions to guide students through analyzing the data and drawing conclusions. These sets of data help students understand financial concepts.
Next Gen Personal Finance
Next Gen Personal Finance: Budgeting Data Crunch
Data Crunches feature one chart or graph followed by five scaffolded questions to guide students through analyzing the data and drawing conclusions. These sets of data help students understand financial concepts such as budgeting.
Next Gen Personal Finance
Next Gen Personal Finance: Paying for College Data Crunch
Data Crunches feature one chart or graph followed by five scaffolded questions to guide students through analyzing the data and drawing conclusions. These pertain to paying for college.
University Corporation for Atmospheric Research
Ucar: Weather and Climate Data Exploration
Students explore the relationship between weather and climate by graphing weather temperature data and comparing with climate averages.
Science Buddies
Science Buddies: Scientific Method Data Analysis/graphs
At the end of your experiment you should review all of the data you have collected. See samples of data analysis charts and graphs. Find out what makes for a good chart or graph using the self-grading rubrics.
Discovery Education
Discovery Education: Science Fair Central: Investigation Set Up and Collect Data
A brief overview of how to gather both quantitative and qualitative data, complete with a sample data table.
Other
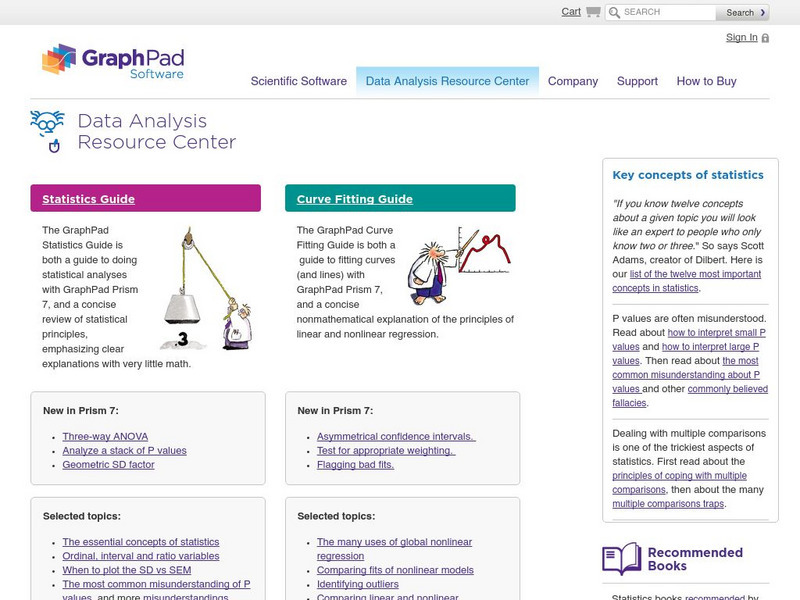
Graph Pad: Data Analysis Resource Center
The GraphPad Statistics Guide is both a guide to doing statistical analyses with GraphPad Prism 7, and a concise review of statistical principles, emphasizing clear explanations with very little math. The GraphPad Curve Fitting Guide is...
Khan Academy
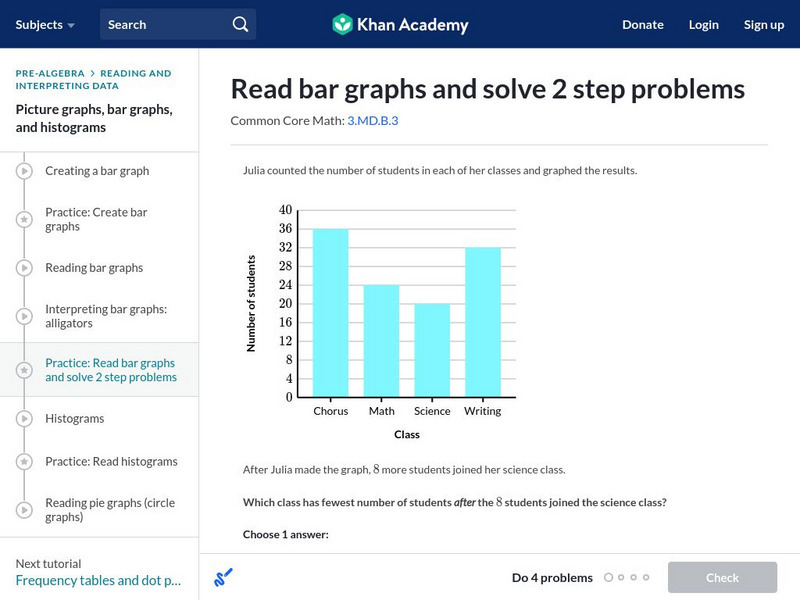
Khan Academy: Read Bar Graphs and Solve 2 Step Problems
Read and interpret a double bar graphs. Students receive immediate feedback and have the opportunity to try questions repeatedly, watch a video or receive hints. CCSS.Math.Content.3.MD.B.3 Draw a scaled picture graph and a scaled bar...
Cyberbee
Adventures of Cyberbee: Graphing
Teacher-directed lesson plan focusing on data analysis, graphing, and probability. Lesson includes a video and engaging spreadsheet activities.
Education.com
Education.com: 1.md.c.4 Worksheets
[Free Registration/Login Required] These worksheets can help students practice organizing, representing, and interpreting data with up to three categories. Choose from among 25 worksheets based on your student's needs.
E-learning for Kids
E Learning for Kids: Math: Elephant Plant: Data and Graphs
On this interactive website students practice various math skills using a real-life scenario involving plants. Those skills include interpreting data in a circle graph, interpreting data in a divided bar graph, and interpreting a bar...
Shodor Education Foundation
Shodor Interactivate: Lesson: Fire!, Probability, and Chaos
Students will simulate the probability of a forest fire then graphing the data.
E-learning for Kids
E Learning for Kids: Math: Rice Field: Data and Length
On this interactive website students practice various math skills using a real life scenario of a rice field. Those skills include understanding information displayed in column graphs, collecting data to answer a question, and measuring...
Shodor Education Foundation
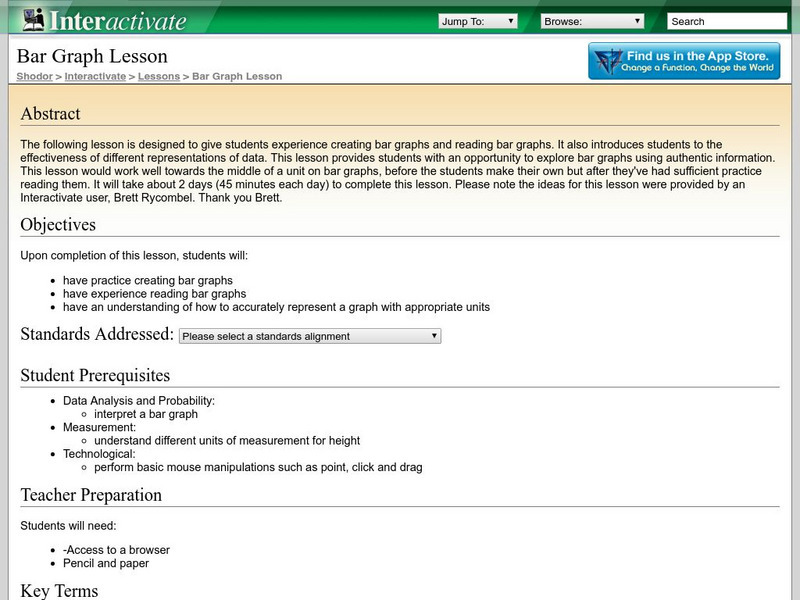
Shodor Interactivate: Lesson: Bar Graph
This instructional activity is designed to give students practice creating and reading bar graphs as well as understanding how to accurately represent a graph with appropriate units.
Annenberg Foundation
Annenberg Learner: Making a Stem and Leaf Plot
A line plot may not be a useful graph for investigating variation so we must come up with a new representation based on groups of data. Construct a stem and leaf plot from a set of 26 data values.
Alabama Learning Exchange
Alex: M&m's and Blogs: Interpreting Data!
In this hands-on, technology-rich lesson, students will interpret data. The students will define words involving graphs, create a bar graph using M&M's, and post information from their findings on the internet. The students will also...
Other popular searches
- Data Analysis and Graphs
- Data and Graphs
- Data Collection and Graphs
- Analyzing Data and Graphs
- Data Sets and Graphs
- Graphs and Data Display
- Graphs and Data Tables
- Analyze Data and Graphs
- Collect Data and Graphs
- Graphs and Data Handling
- Science Data and Graphs
- Data Displays and Graphs


