Curated OER
Writing and Graphing Linear Equations on a Flat Surface
In this linear equations worksheet, students write the equation of a line with given characteristics. They identify the slope of a line and the y-intercept. Explanations and examples are provided at the beginning of the worksheet. This...
Curated OER
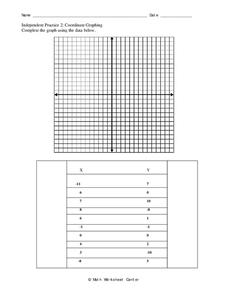
Coordinate Graphing
In this coordinate graph worksheet, 10th graders graph and complete 10 pairs of numbers on the illustrated gird. They graph each x point and label it on the graph. Then, students graph each y point listed on the graph and label those...
Curated OER
Graph Functions: Practice
In this graph functions learning exercise, students complete several activities to help them graph functions. Students use the table and the graph to complete the questions. Students also answer two test prep questions.
Curated OER
"Graph It"
Students work in teams to conduct short surveys of their classmates. They show their results using at least two different types of graphs.
Students separate into teams and are asked that each team to choose something that they are...
Curated OER
Reading a Graph: Azimuth Range vs. Day in Barrow Alaska
Young scholars practice reading a graph while doing story problems. They determine the x and y intercepts and calculate the slope. They also practice writing linear equations.
University of Texas
A Library of Parent Functions
Don't think this lesson is for Mom and Dad; parent functions are all for your high schoolers. Flip through a presentation with a focus slide on each type of graph and its characteristics. Some examples are included but the focus is on...
Curated OER
Location on a Grid
Locating a point on a grid is an important skill to master; use this practice sheet to give schlars some clear and useful experience. On a large, simple grid they use a coordinate system to find specific squares and color them a given...
Curated OER
Number Pairs
What's the coordinate pair? There are 16 letters located on this grid, each marked by a point. Learners record the number pair for each. All of the coordinates are whole numbers. Consider extending this in a fun way by challenging pupils...
Concord Consortium
Function Project
What if a coordinate plane becomes a slope-intercept plane? What does the graph of a linear function look like? Learners explore these questions by graphing the y-intercept of a linear equation as a function of its slope. The result is a...
Curated OER
Linear Equations
Middle and high schoolers complete problems with linear equations and then graph the lines they represent. They complete eight problems.
Curated OER
Is the Rainbow Fair?
Third graders perform statistical calculations. Given a bag of Skittles, 3rd graders sort and collect data regarding the colors included in their bag. Using spreadsheet software, students create a bar graph of the information collected....
Curated OER
Coordinate Graphing
Students practice basic coordinate graphing and plotting points on the coordinate axis. In this geometry lesson, students are introduced to ordered pairs, and the x and y axis.
Curated OER
Graphing Absolute value Inequalities
Students investigate the concept of inequalities and practice graphing them at various degrees of difficulty. They review the basic rules with the teacher at the level of theory which may make it harder for them to understand without...
Curated OER
Scattered About
Middle schoolers are introduced to the concept of scatter plots after reviewing the various types of graphs. In groups, they analyze the type of information one can receive from a scatter plot and identify the relationship between the x...
Virginia Department of Education
Transformationally Speaking
Young mathematicians explore transformations of graphs by graphing sets of functions on the same pair of axes. They use their graphs to determine the effect that the values of a and b in y = ax + b have on the graph of y = x.
Gatsby Charitable Foundation
Four Activities Using Straight Line Graphs
This math packet includes four different activities which puts linear equations and line of best fit in the context of real world applications. Each activity uses a different linear math modeling equation and asks the learners to...
Curated OER
Function Investigation
In this functions worksheet, 11th graders solve and complete 18 different problems. First, they graph each equation on the graphs provided, making a rough sketch on a coordinate plane. Then, students predict what each graph will look...
Curated OER
Linear Functions
In this linear function worksheet, 6th graders solve and complete 3 various types of problems. First, they write the equation of a straight line that passes through a pair of points. Then, students complete each table by filling in the...
Curated OER
Standard Linear Form
Ninth graders identify and describe the x-intercept as the place where the line crosses the x-axis as it applies to football. They create their own differentiations to reinforce the distinction between the x-intercept and the...
Curated OER
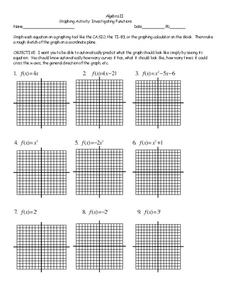
Investigating Functions
For this investigating functions worksheet, 11th graders solve and complete 18 different problems. First, they graph each equation on the graphs shown. Then, students make a rough sketch of graph on a coordinate plane. They also...
Curated OER
Let's Go Slopey
Young scholars create a table of values to graph a line. In this algebra lesson, students identify the slope and intercept of a linear equation. They use a Ticalculator to graph their function.
Curated OER
Plotting Grids Using Battleship
Young scholars coordinate grid points on X and Y axises to plot a physical location. The game of "Battleship is used to present first hand knowledge of this skill.
Curated OER
Life Expectancy at Birth
Learners create a line graph on the life expectancy for males and females in Canada. In this math and health lesson plan, students review table and graph terminology, create line graphs, and analyze the differences in life expectancy...
Curated OER
Equations and Inequalities
For this equations and inequalities worksheet, 9th graders solve and graph 8 different problems that include various systems of equations. First, they determine the solution to each set of system of equations. Then, students graph the...


