Curated OER
Graph and Compare the Adventure's Temperature Vs. Local Temperature
Pupils explore the concept graphing data. In this graphing data lesson, students use weather data from their local weather and some other city and graph them. Pupils plot the local weather vs. another city. Students record temperature...
Curated OER
Do the Elephants Need Sunscreen? A Study of the Weather Patterns in Etosha
Students analyze the weather patterns in Namibia. They create a graph of the yearly temperatures and use the internet to gather information. They discuss how the weather goes in cycles in the area.
Curated OER
Chances Are
Upper graders examine the concept of probability. They collect data and create a bar graph. They must interpret the data as well. Everyone engages in hands-on games and activities which lead them to predict possible outcomes for a...
Curated OER
I'm a Weather Watcher Watching plants grow by......my,my,my
Students investigate how weather affects how plants grow. They collect data on weather and plant growth for a week and display the data on a graph. For a culminating experience they design a movie using software that shows plant growth...
Curated OER
Observing Weather
Students investigate the weather by reading children stories. For this weather observation lesson, students read Cloudy With a Chance of Meatballs and several other stories about weather before they create a KWL chart. Students utilize...
Curated OER
Chucky Chickadee's Bird and Breakfast: Sing in Please
Students observe bird feeding and complete a tally and graphing activity for their observations. In this bird graphing activity, students work in teams to observe bird feedings. Students complete a bird reporting sheet and collect data...
Curated OER
Effects of Temperature, Deviation on Climate
Students collect and record data for a given city. They calculate standard deviation of temperature and analyze the impact of climate changes on a city's and culture.
Curated OER
Global Warming Statistics
Students research real-time and historic temperature data of U.S. and world locations, and analyze the data using mean, median, and mode averages. They graph the data and draw conclusions by analyzing the data. A spreadsheet is used to...
Curated OER
The Air Up There
In this data collection and analysis lesson, learners observe and graph the weather conditions during one school week, then calculate the average weather temperature. Extensions are included.
Curated OER
Hurricane Frequency and Intensity
Students examine hurricanes. In this web-based meteorology lesson, students study the relationship between ocean temperature and hurricane intensity. They differentiate between intensity and frequency of hurricanes.
Curated OER
Seasonal Graphs
In this math worksheet, students create a graph using the data recorded from the local newspaper concerning local temperatures.
Curated OER
The Hudson's Ups and Downs
Even rivers have tides. Older elementary schoolers will discuss the Hudson River and how weather, water craft, and the ocean cause tidal fluctuation. They will examine a series of line graphs that depict tidal fluctuation, then analyze...
Curated OER
Weather Plots
Students investigate the relationship between temperature and humidity. The graphs of weather data gathered and plotted for for an assigned period of time are analyzed and the interpretations shared with the class.
Curated OER
What Goes Up Must Come Down!!
Fifth graders look at actual sunrise and sunset times for their hometown to determine a pattern in the amount of daylight. They collect their data in Excel and create a chart to help them identify the pattern, then write an explanation...
Curated OER
Scatter Plots
Seventh graders investigate how to make and set up a scatter plot. In this statistics lesson, 7th graders collect data and plot it. They analyze their data and discuss their results.
Curated OER
Make a Bar Graph
For this bar graphs worksheet, students use the tally chart to make a bar graph. Students color one box for each tally mark and then use the chart to help answer the questions about the sunny, cloudy, and rainy days.
Curated OER
Scientific Graphs
Students organize data collected from their experiments using graphs. In this statistics and biology lesson, students organize their scientific data from an article into readable graphs. They define the usefulness of their graph and...
Curated OER
THIS WEEK'S WEATHER
First graders create a picture graph representing their town's weather for one week.
Curated OER
The Hudson's Ups and Downs
Fifth graders practice interpreting line graphs of the Hudson River water levels to assess the tides and tidal cycles in the estuary. They explore how weather can affect water levels and tides and observe that high tides and low tides...
Curated OER
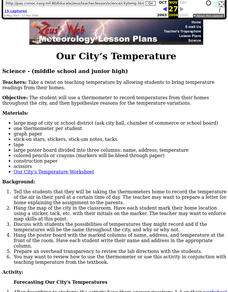
Our City's Temperature
Middle schoolers use a thermometer to record temperatures from their homes throughout the city, and then hypothesize reasons for the temperature variations. They use a weather graph worksheet that's imbedded in this instructional...
Curated OER
Weather Graphs
First graders use their knowledge of weather symbols to organize and construct a graph of the daily weather for one month. Each student have a chance to give the daily weather report using Sammy's Science House Computer Software.
Curated OER
Under the Weather
Students review mean, median, mode, and range while using the newspaper to answer weather questions.
Curated OER
Probability With a Random Drawing
Students define probability, and predict, record, and discuss outcomes from a random drawing, then identify most likely and least likely outcomes. They conduct a random drawing, record the data on a data chart, analyze the data, and...
Curated OER
Phenomenal Weather-Related Statistics
Eighth graders research, collect and interpret data about weather statistics. They record that data on spreadsheets. they create Powerpoint presentations on their individual or group research.


