Curated OER
The Mysteries of El Nino: How Much do We Really Know?
Seventh graders investigate the causes and effects of El Nino and explore its global impact on weather related occurrences through this series of activities.
Curated OER
Good News - We're on the Rise!
Students build and observe a simple aneroid barometer to discover changes in barometric pressure and weather forecasting. They graph changes in barometric pressure for two weeks and make weather predictions.
Curated OER
Tracking Local Weather
In this activity, studens will use different types of weather gauges and track the local weather for a week. After the week is over, students will collect their samples, analyze the data, and compare their conclusions to local weather...
Curated OER
Probability
Here is a classic activity used to introduce your class to the concept of probability and data collection. They will roll one die 30 times, then record and discuss the results. Great introduction, but too shallow to be considered a...
Curated OER
Weather Or Not
Students use the internet to find pen pals to share in their weather experiment. Individually, they research the high and low temperatures for cities within the United States and email the results to their pen pal. They also develop a...
Curated OER
Sensational Seasons
Second graders explore how seasonal weather patterns affect temperature and their lives.
Curated OER
Chucky Chickadee's Bird and Breakfast: Sing in Please
Students observe bird feeding and complete a tally and graphing activity for their observations. In this bird graphing lesson, students work in teams to observe bird feedings. Students complete a bird reporting sheet and collect data...
Curated OER
Scientific Graphs
Students organize data collected from their experiments using graphs. In this statistics and biology lesson, students organize their scientific data from an article into readable graphs. They define the usefulness of their graph and...
Curated OER
The Lake Effect
Fourth graders conduct an experiment demonstrating the effects of water and air temperature on precipitation. They create graphs demonstrating their findings using Claris Works for Kids.
Curated OER
Graphing Climate Information
Seventh graders plot the data for the average monthly precipitation for three cities. They make a graph using a spreadsheet.
Curated OER
Weather Conditions During the Fall Monarch Migration
Students keep detailed weather records during the fall migration of the monarch butterfly. They compare weather conditions to the days they do and do not see monarchs. As a class, they graph and analyze data and send it to a university...
Curated OER
Using Radiosonde Data From a Weather Balloon Launch
Student use radiosonde data from a weather balloon launch to distinguish the characteristics of the lower atmosphere. They learn the layers of the atmosphere. They graph real atmospheric data.
Curated OER
Weather Conditions During the Spring Monarch Migration
Students keep detailed weather records during the spring migration of the monarch butterfly. To keep track of the weather, students utilyze weather reports and instuments such as anemometers, compasses, thermometers and rain gauges.
Curated OER
Worm Weather Predicted
Students examine worm habitats. In this animal habitats lesson plan, students participate in a lab activity that requires them to explore the adaptations that earthworms make to their environment.
Curated OER
Hudson River Salt Front Activity
In this Hudson River worksheet, students read a passage about the Hudson and salinity, they complete graph interpretation and questions and activities.
Curated OER
The Weather and Recess #157
Students track the daily weather at recess time for a number of weeks. They design a bar graph of the different types of weather. They discuss how weather changes affect recess time. They write a list of optional recess activities for...
Curated OER
Weather Plots
Students investigate the relationship between temperature and humidity. The graphs of weather data gathered and plotted for for an assigned period of time are analyzed and the interpretations shared with the class.
Curated OER
Weather Variables Lab
Students examine what happens when air temperature drops and gets closer to the dewpoint. They perform a lab activity which illustrates the effects on humidity, precipitation and barometric air pressure.
Curated OER
Graphing Data - Temperature
Seventh graders measure and record temperature over a given time period. They compare the recorded temperatures to the 40-year recorded normal average temperatures for the same area. Students display and interpret their findings in a graph.
Curated OER
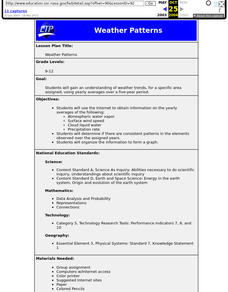
Weather Patterns
Students use yearly averages over a five-year period to understand weather trends for a specific area.
Curated OER
Design Weather Instruments using LEGO Sensors
Students design and create a LEGO structure that will house and protect a temperature sensor. They leave the structure in a safe spot and check the temperature regularly and chart it. After the students have built their structures, the...
Curated OER
Wet Weather, Wet Climate
Students discover the differences between weather and climate in this long-term lesson introduction. They create rain gauges and practice reading rainfall measurements, view a website showing the cloud cover in their location and draw...
Curated OER
Weather is Cool, Hot or Somewhere In-Between
Students access the Internet to record data on weather. They use email to answer a younger classes' questions about the weather.


