Curated OER
Run-off Race
Students create wetland models in pans and use them to experiment to see how plants help slow the flow of runoff water and keep our waterways clean.
Center for Innovation in Engineering and Science Education, Stevens Institute of Technology
Ciese Real Time Data Projects: Weather Scope: A Study of Weather and Climate
Use real-time data to study factors that affect weather and climate, create weather instruments, and share data with students around the world.
University Corporation for Atmospheric Research
Ucar: Weather and Climate Data Exploration
Students explore the relationship between weather and climate by graphing weather temperature data and comparing with climate averages.
NASA
Nasa: Precipitation Towers: Modeling Weather Data
This lesson uses stacking cubes as a way to graph precipitation data, comparing the precipitation averages and seasonal patterns for several locations. Variations on the lesson can accommodate various ages and ability levels. Students...
University Corporation for Atmospheric Research
Ucar: Get the Picture Severe Weather
Students review graphs and charts of severe weather data then answer "True and False" questions about the content conveyed.
Geographypods
Geographypods: Weather and Climate Graphing It!
Explores the difference between weather and climate and how they are measured. Students will complete activities and construct a climate graph from raw data. They will also learn about the physical structure of the rainforest, its...
University Corporation for Atmospheric Research
Ucar: Differences Between Climate and Weather
In this activity, students collect weather data over several days or weeks, graph temperature data, and compare the temperature data collected with averaged climate data where they live.
Concord Consortium
Concord Consortium: Smartgraphs: Hurricane Katrina
Students are given graphs relating to Katrina, the hurricane that devastated New Orleans and much of the gulf coast in 2005, and are asked to identify various events, such as the moment when the hurricane made its closest approach to New...
TeachEngineering
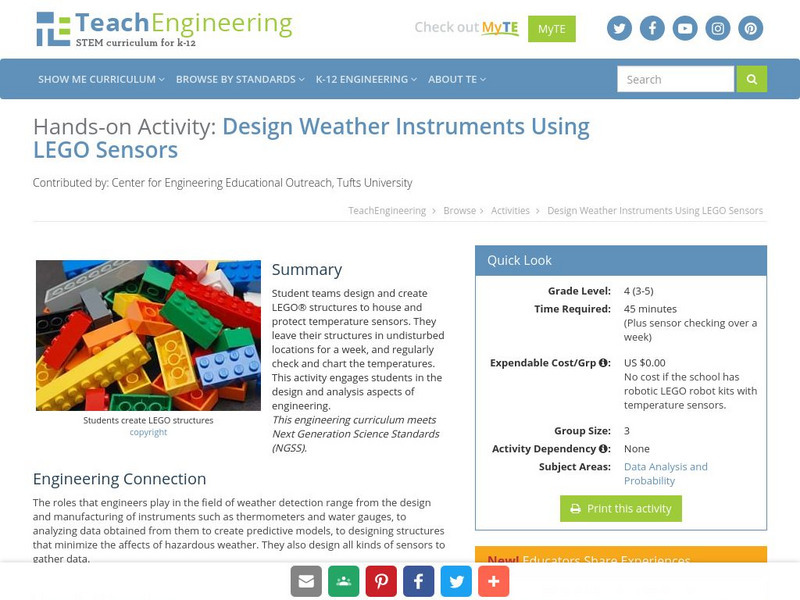
Teach Engineering: Design Weather Instruments Using Lego Sensors
Students will design and create a LEGO structure that will house and protect a temperature sensor. They will leave the structure in a safe spot and check the temperature regularly and chart it.
University Corporation for Atmospheric Research
Ucar: Introduction to Climate
A detailed overview of the Earth's climate, with explanations about the difference between weather and climate, dendrochronology, palynology, and how Earth's climate has changed over time. All information is reinforced through pictures,...
Science Education Resource Center at Carleton College
Serc: Introduction to Texas Hurricanes
In this activity, students are asked to graph data about some 20th century hurricanes that hit the Texas coastline. For each graph, they are asked several questions about any apparent correlation between the different variables. Students...
Science Education Resource Center at Carleton College
Serc: Do You Really Want to Visit the Arctic?
This jigsaw activity is designed for students to become familiar with several datasets of Arctic weather data, collected in Eureka on Ellesmere Island. Students join a role-playing activity to read and interpret graphs while considering...
TeachEngineering
Teach Engineering: Engineering for the Earth
Young students are introduced to the complex systems of the Earth through numerous lessons on its natural resources, processes, weather, climate and landforms. Key earth science topics include rocks, soils and minerals, water and natural...
Science Education Resource Center at Carleton College
Serc: Measuring and Comparing Temperatures
Using thermometers, students will compare differences in the temperature of various materials and locations. They will record and chart the data that was collected and present the graphs to their classmates.
University Corporation for Atmospheric Research
Ucar: Project Sky Math
Teachers will be interested to explore the SkyMath module, and the 16 classroom activities at this site. In this program, students will collect and record real-time weather data to analyze. Data analysis, graphing, number relationship,...
Texas Instruments
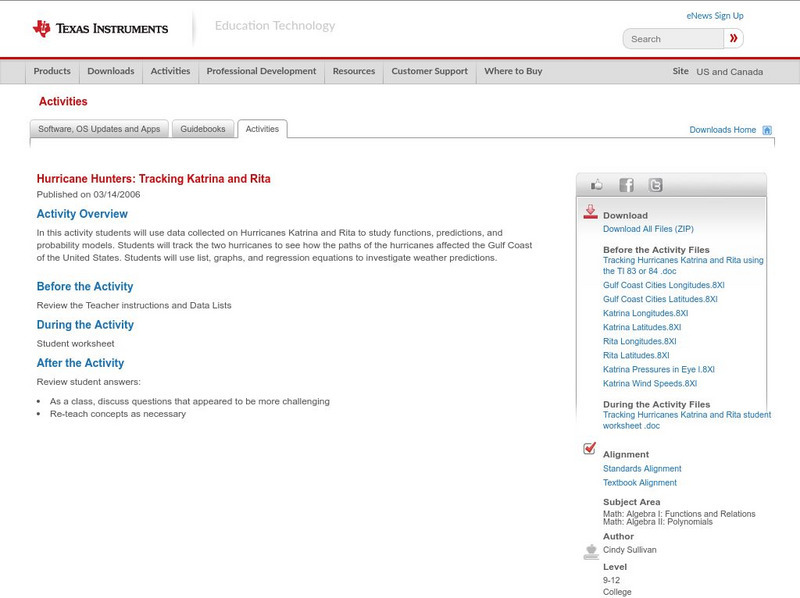
Texas Instruments: Hurricane Hunters: Tracking Katrina and Rita
In this activity students can use data collected on Hurricanes Katrina and Rita to study functions, predictions, and probability models. Students will track the two hurricanes to see how the paths of the hurricanes affected the Gulf...
Other
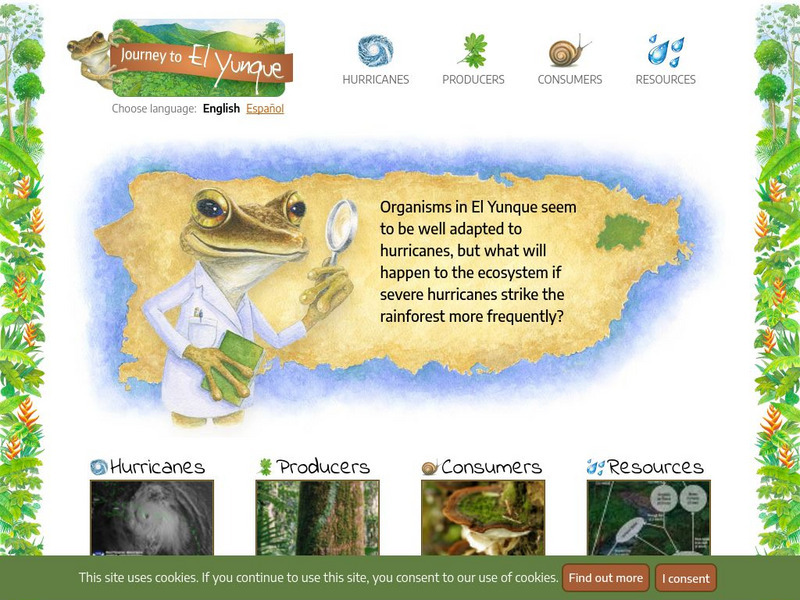
The Learning Partnership: Journey to El Yunque
In this set of learning modules, students examine the impact of hurricane weather on the El Yunque rainforest in Puerto Rico. They learn about hurricanes, producers, consumers, and the food chain, and how disruptions in organisms'...
