Curated OER
Weather Conditions
Students list and name various kinds of weather conditions occurring in their city. Using the newspaper as a resource, students answer questions relating to written weather reports. This lesson is intended for students acquiring English.
Curated OER
Weather Forecasting Basics
Eighth graders analyze weather diagrams and weather maps. In this earth science lesson, 8th graders explain why it is important to know the weather. They complete a handout at the end of the lesson.
Curated OER
Weather
Students collect daily weather types throughout the school year using a spreadsheet program and Meteorologist freeware in order to predict weather changes and compare seasons. An Appleworks worksheet is included.
Curated OER
Cloud Observation and Graphing
Students identify the three major cloud groups. They are introduced to the three main cloud types and spend a week making and recording observations of clouds. Students produce a graph that presents their findings and conduct research...
Curated OER
Weather is Cool, Hot or Somewhere In-Between
Students access the Internet to record data on weather. They use email to answer a younger classes' questions about the weather.
Curated OER
Texas Weather Report
Students use provided links to observe selected weather sites and collect temperature and precipitation data for listed cities. They enter the information onto their spreadsheet. Students study maps of the Texas natural reagions,...
Chicago Botanic Garden
Climate Change Around the World
It is unknown if cloud cover increases in response to carbon dioxide levels changing, helping climate change slow down, or if cloud cover decreases, allowing Earth to warm faster. Part four in the series of five lessons has classes...
Columbus City Schools
What is Up Th-air? — Atmosphere
Air, air, everywhere, but what's in it, and what makes Earth's air so unique and special? Journey through the layers above us to uncover our atmosphere's composition and how it works to make life possible below. Pupils conduct...
Curated OER
Tracking Fall's Falling Temperatures
Young meteorologists track weather from day to day and record results on graphs, maps, or other places. They see firsthand how weather temperatures trend cooler as fall progresses and practice grade-appropriate skills in geography (map...
Curated OER
Cloudy Days are for Reading and Writing
Young scholars research weather proverbs and determine the scientific validity of 3 weather proverbs. They write an essay presenting their reasoning. They interview elderly people to graph the most frequently heard proverbs and theorize...
Curated OER
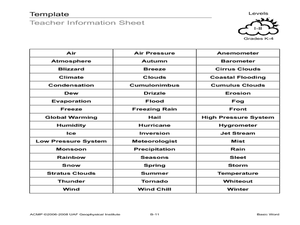
Basic Word
Students create a poster of a weather-related word. In this weather lesson, students randomly choose a weather word, define it, and draw a picture of it. They also use Word Art to create the title of their poster.
Curated OER
The Air Up There
In this data collection and analysis lesson, students observe and graph the weather conditions during one school week, then calculate the average weather temperature. Extensions are included.
Curated OER
Good News - We're on the Rise!
Students build and observe a simple aneroid barometer to discover changes in barometric pressure and weather forecasting. They graph changes in barometric pressure for two weeks and make weather predictions.
Curated OER
Oceanic Heat Budget Activities
Students map and research imaginary islands located in different parts of the world. They describe the weather and climate of their island and show how local currents, water temperatures and waves may influence the weather patterns.
Curated OER
Data Analysis and Measurement: Ahead, Above the Clouds
Students explore and discuss hurricanes, and examine how meteorologists, weather officers, and NASA researchers use measurement and data analysis to predict severe weather. They plot points on coordinate map, classify hurricanes...
Curated OER
Fahrenheit Follies
Second graders analyze the effects of sunlight on a glass of water by using the thermometer to measure its temperature. They predict and measure the difference between water outside in the sun and shade and inside. They role-play a game...
Curated OER
Air Pressure & Barometers
Fourth graders observe, measure, and record data on the basic elements of weather over a period of time (i.e., precipitation, air temperature, wind speed and direction, and air pressure). Then, they make a barometer and keep record of...
Curated OER
How Oceans Affect Climate
Students draw conclusions about how the ocean affects temperature. In this weather lesson plan, students use the Internet to gather data to help them come to a conclusion about how the climate in a certain region is directly affected by...
Curated OER
Phenomenal Weather-Related Statistics
Eighth graders research, collect and interpret data about weather statistics. They record that data on spreadsheets. they create Powerpoint presentations on their individual or group research.
Curated OER
Exploring Literature And Weather Through Chirps
Students explore using crickets' chirps to calculate temperature. They read "Cricket in Times Square" and "The Quiet Cricket," read and discuss a Cricket eBook, develop a formula and calculate temperature using cricket chirps, and graph...
Curated OER
Math Investigations 2
Young mathematicians practice measuring and graphing skills while working in groups to measure objects found in the classroom. Using their measurements, they create one bar graph displaying the lengths and another displaying the widths.
Curated OER
Chances Are
Upper graders examine the concept of probability. They collect data and create a bar graph. They must interpret the data as well. Everyone engages in hands-on games and activities which lead them to predict possible outcomes for a...
Curated OER
Basic Excel
Students explore basic Excel spreadsheets. For this spreadsheet lesson plan, students enter Alaska weather information and perform calculations. Students title the columns on the spreadsheet and format the cells. ...
Curated OER
The Weather Forecast
Students observe a daily paper to see the temperature forecast looking at a paper thermometer with today's predicted temperature colored in. They predict today's temperature, and paste the second color on the same thermometer to show...
Other popular searches
- Graphing Weather Data
- Graphing Weather Activity
- Weather Graphing
- Weather Graphing Temperature
- Weather Graphing Probability


