Curated OER
Interpreting Line Graphs
Fifth graders interpret line graphs. In this graphing activity, 5th graders first begin by reviewing the difference in bar and line graphs and what they are used for. Students practice interpreting the data on various line graphs and...
Curated OER
Comparing Data on Graph A and Graph B
Second graders gather and graph data. In this graphing lesson, 2nd graders collect data and graph this information using tally charts, bar graphs, pictographs, or tables. They make predictions about the outcomes.
Curated OER
Identifying Horizontal, Vertical and Oblique Lines
Third graders watch the teacher draw a horizontal line across the board. They listen to the definition of horizontal and has a student demonstrate putting their body in a horizontal position. This is repeated with a vertical line. The...
Curated OER
Systems of Linear Inequalities
Graphing systems of linear inequalities is the focus of this instructional activity. Problems range from checking solutions of inequalities, graphing systems of two inequalities, and graphing systems of three inequalities. Graphing...
Curated OER
The Human Graph
Students produce a graph of favorite colors. For this graphing lesson, students create a human graph based on their favorite color then the teacher transfers the data to a bar graph. Students compare the lines on the graph before...
Curated OER
The Order of Things on a Coordinate Grid
Learners are able to identify ordered pairs on coordinate plane, and graph points on a coordinate plane. They are able to write an ordered pair for each of the points on a graph, and create a design or picture using ordered pairs.
Curated OER
Parallel and Perpendicular Lines
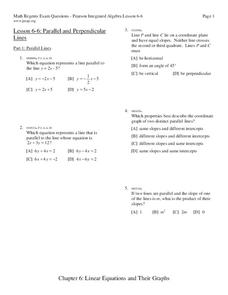
In this algebra/geometry worksheet, learners investigate the slopes and equations of parallel and perpendicular lines. The two page worksheet contains a combination of eleven multiple choice and free response questions. Solutions are...
Curated OER
The Slope of Parallel and Perpendicular Lines
In this Algebra I/Algebra II worksheet, students examine slope to determine if the given lines are parallel or perpendicular. Students determine the equation of lines that are either parallel or perpendicular to the given line. The two...
Curated OER
Writing and Graphing Linear Equations on a Flat Surface
In this linear equations worksheet, students write the equation of a line with given characteristics. They identify the slope of a line and the y-intercept. Explanations and examples are provided at the beginning of the worksheet. This...
Utah Education Network (UEN)
Finding Slope of a Line from Graphs, Tables, and Ordered Pairs
Middle schoolers explore the concept of slope in numerous ways and start to look at simple linear equations. They describe the slope in a variety of ways such as the steepness of a line, developing a ratio, using graphs, using similar...
Curated OER
Finding a Line of Best Fit
Pupils engage in the practice of creating a scatter plot with the data obtained from measuring different resting heart rates. The data is used to create the table that is translated into a graph. The lesson gives instructions for the use...
Curated OER
Graphing Inequalities in Two Variables: Extra Practice 30
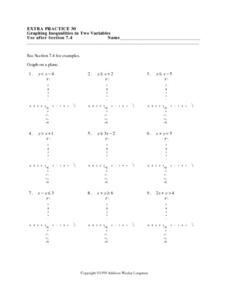
In this math worksheet, students graph inequalities on a coordinate grid. The eight problems have a coefficient of one for the y variable. Three problems have a negative value for y. The final four problems are horizontal or vertical lines.
Curated OER
Graphing Ordered Pairs
Here is graphing activity which has pupils graph ordered pairs and label the axis. They graph five ordered pairs and then interpret the data in the graph.
Curated OER
Show Me The Data!
Pupils create a bar graph. They will collect and organize data to turn into bar graphs. They create graphs for the favorite sports of the class, color of M&M's, and types of cars passing by.
Curated OER
The Cartesian Plane
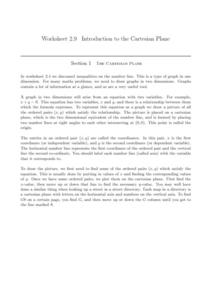
Learners solve and complete 22 various types of problems. First, they find the gradients of the lines and plot the given points. Then, they complete the table of values for each equation and use the table to draw the graph.
Curated OER
Line and Double Line Graphs: Reteach
In this graphing worksheet, students review the five steps for making a double line graph to display data. Students then use the graph they made following the shapes to answer the three questions.
Curated OER
Connecting With Coordinates
Play a coordinates game to encourage collaborative learning and grid use! Learners plot points on grids and play a game that challenges them to locate a specific point on a coordinate grid by using horizontal and vertical movements.
Curated OER
Learn How to Graph
Students examine various types of charts and discover how to construct a line graph. Using graph paper, they construct a graph displaying weight loss over a five-year period. They draw copnclusions from the completed graphs.
Curated OER
Graphing Lesson Plans
By using hands-on graphing lesson plans students can learn how to collect data, and display the information using graphs.
West Contra Costa Unified School District
Conics Introduction and Parabolas
Where did conic sections get their name? The equation and graph of a parabola are developed from the definition of the conic section. Teacher examples on graphing the equation and writing an equation from the graph round out the plan.
West Contra Costa Unified School District
Shifting Linear Equations in Function Notation
Time for a shift in thinking! Learners examine translations of linear functions. They use function notation to describe the translation and make connections to the graph.
Curated OER
Study Buddies: Reading Line Graphs
For this math worksheet, students will work with a coach to solve a problem by reading a line graph. Students will follow a step-by-step process and notes are provided for the coach.
Curated OER
Frequency, Histograms, Bar Graphs
In this statistics worksheet, students plot and graph their data, then interpret the data using the correct form of graphs. There are 3 detailed questions with an answer key.
Curated OER
Shell Graphing
Fifth graders explore the four quadrants of a coordinate grid. In this graphing lesson plan, 5th graders trace sea shells in each of the four quadrants of a coordinate grid and then label the ordered pairs on each shell. For the final...


