Curated OER
Graphing Linear Functions Two
Use this graphing linear functions worksheet to have learners graph three linear equations. They use a table of values, the intercept method, and slope-intercept form to graph three functions.
Curated OER
Graphing Linear Functions
In this linear functions worksheet, students graph 3 linear functions. Students graph each function by making a table of values given a linear function in standard form.
Curated OER
Understanding Latitude and Longitude
Teaching learners about latitude and longitude can get a little complicated. Present the concept by first representing it as a graph. Just like finding a location on a graph using the x and y-axis, learners will be able to locate items...
Curated OER
Data and Probability: What is the Best Snack?
In this math/nutrition lesson, the nutritional value of 3 snack foods is recorded on a data chart and represented on a bar graph. Students analyze and compare information, construct data charts and related bar graphs, and draw...
EngageNY
Piecewise Functions
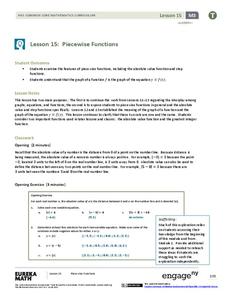
Show your class members that if they can graph a linear function, they can graph an absolute value function. Groups create an absolute value graph using a table, then entertain the idea of an absolute value function defined as two pieces...
EngageNY
Representations of a Line
Explore how to graph lines from different pieces of information. Scholars learn to graph linear functions when given an equation, given two points that satisfy the function, and when given the initial value and rate of change. They solve...
Concord Consortium
Intersections I
One, two, or zero solutions—quadratic systems have a variety of solution possibilities. Using the parent function and the standard form of the function, learners describe the values of a, b, and c that produce each solution type. They...
Illustrative Mathematics
Puzzle Times
Give your mathematicians this set of data and have them create a dot plot, then find mean and median. They are asked to question the values of the mean and median and decide why they are not equal. Have learners write their answers or...
BW Walch
Solving Systems of Linear Equations
Solving systems of equations underpins much of advanced algebra, especially linear algebra. Developing an intuition for the kinds and descriptions of solutions is key for success in those later courses. This intuition is exactly what...
Curated OER
Graphing Absolute Value Equations
In this algebra worksheet, students graph absolute value equations and use translations to move the graph around on a coordinate plane. There are 4 questions with an answer key.
Curated OER
Solving Open Sentences Involving Absolute Value
In this math worksheet, students solve 6 open sentences and graph solutions using a line graph. Students then express 2 story problems in terms of inequalities. Students then write open sentences for 2 graphs.
Curated OER
Graphs Involving Absolute Value
In this Algebra I/Algebra II worksheet, students graph absolute value functions. The two page worksheet contains four multiple choice questions. Answers are included.
Curated OER
Math Regents Exam Questions: Graphing Rational Functions
For this graphing rational functions worksheet, students answer 18 multiple choice problems about rational functions. Students determine values for a which a function is undefined given the equation of the function.
Curated OER
Basic Algebra and Computers: Spreadsheets, Charts, and Simple Line Graphs
Students, while in the computer lab, assess how to use Microsoft Excel as a "graphing calculator." They view visual representations of line graphs in a Cartesian plane while incorporating basic skills for using Excel productively.
Curated OER
Graphing the Absolute Vaule Function
Learners investigate the graph of the absolute value function and the relationship between the parameters of the equation and the graph of the function.
Curated OER
Absolute Value Inequalities
In this absolute value inequalities worksheet, students solve given inequalities and graph their solution. This four-page worksheet contains 26 problems. Answers are provided on the last two pages.
Curated OER
Graphing and Analyzing
In this graphing and analyzing worksheet, 9th graders first state if each graph represents a linear or nonlinear relationship. Second, they create a difference table for each set of data presented and determine whether it represents a...
Curated OER
Olympic Bar Graphs
In this Olympic bar graph worksheet, learners pick a sport from the 2004 Olympic games and find data from the Olympic web page. They graph the scores (times, distance, or speed) and the medals. They answer questions about the variables...
Curated OER
Info. From a Graph
In this graphing worksheet, students answer 13 questions about 3 graphs. Students determine the degree, roots, y-intercepts, inflection points, multiplicity, etc. of three different graphs.
Texas Instruments
Mean Value Theorem
High schoolers calculate the slopes of secant lines. In this calculus lesson, students graph tangent and secant lines using the coordinate plane. They use the Ti calculator to graph and observe the lines.
Curated OER
Place Value
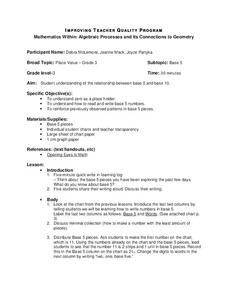
Third graders study the relationship between base 5 and base 10. They determine zero is a place holder and how to read and write base 5 numbers. They reinforce previously observed patterns in base 5 pieces. They choose another base and...
Curated OER
Absolute Value
In this algebra worksheet, learners solve absolute value equations through graphing and algebraically. There are 50 questions.
Curated OER
Graph of a Function
In this graph of a function worksheet, students graph a function and find the value at a given point. They determine the absolute minimum and maximum of an interval. This two-page worksheet contains three problems.
Curated OER
Graphing Our Snacks
Students gather information from Nutrition Facts labels on their favorite snack foods. They graph the fat content of the foods and reflect on what they see.


