Curated OER
Polluted Soil
Students take plants of their own choice and pollute the soil with a pollutant of their own choice or one assigned by the teacher. They regularly record observations such as plant growth, health, and soil pH.
Curated OER
Aksing Questions -- What is Fame?
Students distribute copies of a survey to the local community about famous women. They gather the data and present it in a clear way. They examine the community's view on different issues.
Curated OER
World-wide Search for the Dominant Trait
Students receive instruction on dominant/recessive traits, access World-Wide Search for the Dominant Trait and download information on which traits to assess. They collect data on at least 20 people and prepare a data chart.
Curated OER
Calculus
Students make an inquiry with the aid of technology into the concept of functions. The emphasis of the lesson is on the interplay between the geometric and analytic information.
Curated OER
Teaching about Diel Temperature Variation
Learners explore temperature variation in lakes and deal with the data.
Curated OER
Glacial Change
Students research the ways in which scientists study glaciers and glacial change. They interpret real time data and calculate the estimated global sea level rise potential. A very good instructional activity to illustrate global warming.
Curated OER
Successful Resource-based Learning Strategies for the Geography of Canada Course
Students conduct a statistical research project on population changes. They evaluate demographic issues, such as the size and location of native people. immigrant groups, and the age and gender of the population.
Curated OER
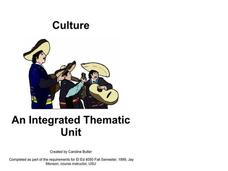
Defining Culture
Second graders define the term culture and are exposed to a variety of cultures from around the world. They read books, play Native American games, develop a class book that examines their own culture and, after examining currencies from...
Curated OER
Tell Me a Story
Tenth graders read short story, "The Storyteller" by Saki, and expand on concept of stories for students by reading and evaluating several popular students's stories as well as writing their own original students's stories.
Curated OER
Life During the Industrial Revolution
Seventh graders present information about the Industrial Revolution. In this Industrial Revolution lesson, 7th graders work in groups research inventions and prepare an information poster for the invention. Students present their poster.
Curated OER
Downhill Discoveries
Young scholars are involved in hands-on activities to determine how course conditions affect bobsled, luge, and downhill ski races.
Curated OER
Bioremediation
Students design and conduct investigations that illustrate the effect bioremediation has on organic matter and determine environmental applications. They, in groups, present their findings to the class.
Curated OER
Gwynns Falls
Students investigate the question: What is the impact of urban development and expansion on the health of a decidious forest ecosystem and humans? They examine the issue of land development by responding to a specific scenario and...
Curated OER
A Change of Climate
Students research various sources to learn about global warming. They then create a multimedia presentation about global warming. They take a stance on the issue and present that as well.
Curated OER
1Word and Letter Match Puzzle
In this word and letter match activity, students match groups of 3 letters to words that contain each set. A reference web site is given for additional activities.
Curated OER
Investigate Non-native Neighborhood Invasion Species
Learners investigate non-native species that are invading local or state environments. They choose one species to research and report on.
TeachEngineering
Teach Engineering: Using Graph Theory to Analyze Drama
Students analyze dramatic works using graph theory. They gather data, record it in Microsoft Excel and use Cytoscape (a free, downloadable application) to generate graphs that visually illustrate the key characters (nodes) and...
TeachEngineering
Teach Engineering: Graphing Your Social Network
Students analyze their social networks using graph theory. They gather data on their own social relationships, either from Facebook interactions or the interactions they have throughout the course of a day, recording it in Microsoft...
Other
Laus Dnet: Grade 5 Excel Lesson Plan
In this online instructional activity, young scholars will survey students in their school to determine their favorite type of hand-held ice cream. Before performing the survey, young scholars will make predictions about which ice creams...
Other
Water on the Web
Water on the Web (WOW) is an advanced site allowing students to actively participate in data analysis from real research sites. Lesson plans on a range of topics are provided. There is also a tutorial for using Excel to graph WOW data.
Other
Lt Technologies: Creating Pictographs With Excel
Concise set of directions teaching how to create a basic pictograph using Microsoft Excel.
ClassFlow
Class Flow: Ice Cream Bar Graph
[Free Registration/Login Required] This flipchart reviews bar graphs, how to create them and read them. Excellent activity to get your students involved in a tasty math activity!
TeachEngineering
Teach Engineering: Air Pollution in the Pacific Northwest
Students are introduced to measuring and identifying sources of air pollution, as well as how environmental engineers try to control and limit the amount of air pollution. In Part 1, students are introduced to nitrogen dioxide as an air...
Science Education Resource Center at Carleton College
Serc: Exploring Regional Differences in Climate Change
Students create a set of graphs that facilitate comparison of climate change predicted for various states. They also use Microsoft Excel to create a graph showing precipitation data.


