Curated OER
Quadratic Functions
Students graph quadratic equations on paper and check their results on the graphing calculator. They predict the direction of the graph and the vertex point. Students use the vertex, axis of symmetry and knowledge of which direction the...
Curated OER
Peak Flow Meter Exercise
Students investigate the concept of lung capacity. They use flow meters to measure the maximum capacity of themselves and others. The data is collected in order to make some conclusions concerning the mean of individual lung capacity....
Curated OER
A FOREST'S PLACE IN OREGON
Young scholars engage in a lesson to find the purpose for the forests of Oregon. The role of the forest is researched according to different geographic perspectives. The information is portrayed in graphs and presented by group members...
Curated OER
Remembering Our Veterans Data Management Project
Seventh graders utilize data collected from various sources based on Canadian military statistics to consolidate their understanding of data management. Students plan and create a PowerPoint presentation using this data including in...
Curated OER
Timeline - Curriculum Connections
Young scholars research a timetable for the building of the Tacoma Narrows Bridge. After the research is completed, students construct a graph and come up with different proposals for the building of the bridge.
Curated OER
Measures of Spread
Students explore the concept of measures of spread. In this measures of spread lesson, students calculate the standard deviation for a set of data. Students use the standard deviation to analyze and describe the set of data. Students...
Curated OER
The Hundred Penny Box
Sixth graders research payload specialists and see how many are men and how many are women and what countries they come from. They then create an excel spreadsheet to reflect data they found and must have two graphs for interpretation.
Curated OER
Power Point -- Science Portfolio
Students are introduced to Microsoft PowerPoint. Using the internet, they research a topic of interest to them related to science. They create three slides and share them with the class. They also discover how to print the slides and...
Curated OER
Math/Technology: Height Measurement
Third graders, using technology tools, determine the total height of their classmates in both inches and centimeters. Once the measurements are taken, they enter the results in the Excel file. Once students have prepared a KidPix number...
Curated OER
Virtual Vacation
Students select a foreign city, research the city using the Internet, and plan an eleven-day vacation to that city. This lesson is ideal for a social studies classroom and includes ideas for using iMovie, Excel, and MS Works or AppleWorks.
Curated OER
To Drink or not to Drink
Seventh graders discuss water quality, water availability and water resources and how water is used in the world around them. They view a video on water quality then test for pH, temperature and dissolved oxygen to indicate water quality.
Curated OER
Weather Or Not
Students use the internet to find pen pals to share in their weather experiment. Individually, they research the high and low temperatures for cities within the United States and email the results to their pen pal. They also develop a...
Curated OER
2D Kinematics w/ String Racers
Students calculate the speed of string racers. In this physics lesson, students measure the time in several trials and get the average. They graph their results using a spreadsheet.
Curated OER
SC Populations Along Major Interstates
Students examine the population among the interstates in South Carolina. Using the internet, they identify the counties and roads and compare it with their own drawing.
Curated OER
Science: Trouble in the Troposphere
Students research a NASA Website and record information about an assigned city's tropospheric ozone residual monthly climate. In groups, they graph the information for the past year. They form new groups and compare their city's...
Curated OER
Stock It To Me
Students investigate the stock market using stock market tables, charts, and graphs. They participate in a simulation of stock market investment over time. They read about the history of Wall Street and the Stock Market.
Curated OER
Strength Building
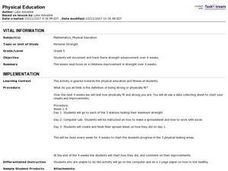
Fifth graders go to each of the 3 stations testing their maximum strength and then make a spreadsheet and how to work with excel. Students create and finish their spread sheet on how they did on day 1.
Curated OER
Slope Fields
Students sketch a slope field for a given differential equation, given a slope field. They also match a slope field to a differential equation and match a slope field to a solution of a differential equation. Finally, students use a...
Curated OER
The Breathtaking Nature of the Urban Explosion, Part 2
Students explore ozone levels. They measure the concentrations of ground-level ozone in the atmosphere. Students observe changes in the concentrations of ozone over time. Students complete a data sheet to record ozone readings over a...
Curated OER
The Box with the Greatest Volume
Students use measurement tools to measure the nearest 16th of an inch. They connect fractions and their decimal equivalents and compare this with other decimals. Finally, the class uses algebraic concepts and formulas to solve problems.
Curated OER
Drive-Thru Nutrition
Students research fat and calorie content of various food items at 12 popular fast-food restaurants. They compare the foods and create a day's worth of healthy menus using food from those restaurants.
Curated OER
Texas Weather Report
Students use provided links to observe selected weather sites and collect temperature and precipitation data for listed cities. They enter the information onto their spreadsheet. Students study maps of the Texas natural reagions,...
Curated OER
Is There a Doctor in the House
Sixth graders predict outcomes of research. They analyze data and construct a class graph, then work cooperatively in a small group setting. They explain the prevention aspect of medicine, document references, and continue ongoing...
Curated OER
Go Yankees!
Young scholars use the internet to research the New York Yankees baseball team. After gathering their information, they discuss the challenges faced by the team and how they were overcome. They end the lesson by examining the math and...


