Curated OER
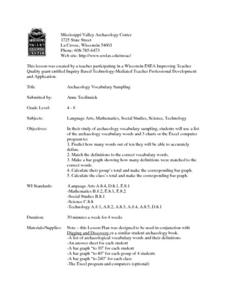
Archaeology Vocabulary Sampling
Students predict how many words out of ten they accurately define. They match the definitions to the correct vocabulary words and make a bar graph showing how many definitions were matched to the correct words. The write their group...
Curated OER
Impact Craters and Water on Mars
Students explore for water on Mars using impact crater morphology. During this lab, students: investigate how to use the equation writing and graphing capabilities in Microsoft Excel, then develop and apply an impact crater...
Curated OER
Create and Analyze Rectangular Patterns
Students explore the concept of geometric patterns. In this geometric pattern lesson, students use Microsoft Excel to explore geometric patterns. Students analyze growth rates of pattern growth. Students create their own patterns and...
Curated OER
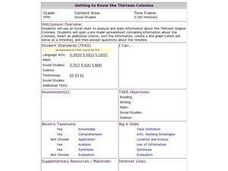
Getting to Know the Thirteen Colonies
Fifth graders analyze information about the thirteen colonies. Using the information, they can manipulate and identify a region in which the colony is located. As a class, they make generalizations about the various regions and time...
Curated OER
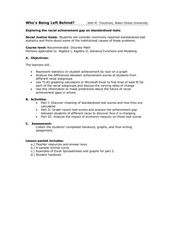
Who is Being Left Behind?
Students investigate scores as they relate to race. In this algebra lesson, students analyze standardized scores and how race can affect these scores. They plot their findings on a graph and draw conclusions.
Curated OER
Measuring Ourselves
Fifth graders conduct various measurement activities on themselves and a partner. They measure their height, weight, thumb-to-pinky span, and body temperature, recording the information in the form of an Excel spreadsheet.
Curated OER
What Temperature Is It?
Students use the internet to research information on the average maximum and minimum temperature for a city in their state. They create spreadsheets and enter data to analyze the information, focusing on averages, maximums, minimums and...
Curated OER
Survey Project
Eighth graders create a website using FrontPage. They use inserted forms to collect survey information and use Microsoft Excel and MS Word to create a presentation of the survey and the results.
Curated OER
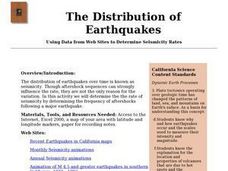
The Distribution of Earthquakes
Students determine the rate of seismicity by determining the frequency of aftershocks following a major earthquake. They incorporate the use of the Internet, Excel 2000, a map of their area with latitude and longitude markers, and paper...
Curated OER
When You're Hot, You're Not!!
Students investigate volcanoes. In this landforms lesson, students locate two volcanoes on a world map. Students compare and contrast the types of volcanoes by using various Internet sites.
Curated OER
Adjectives in Dialogue
Ninth graders use adjectives to depict setting and reveal character and incorporate adjectives into dialogue appropriate for setting.
Curated OER
Weather v. Climate
Ninth graders discuss the differences between climate and weather as a class. Using data they collected, they create a graph of the data to share with the class over a specific time period. They compare and contrast this data with...
Curated OER
Geometric Transformations
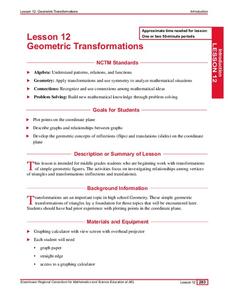
Learners solve problems involving transformations of geometric figures. They review graphing points in the coordinate plain, plot points and connect to create a triangle. Then, they reflect triangles over the x and y axis and use...
Curated OER
Universal Studios' Roller Coasters
Students read an article and review a type of graph or other graphic representation. They write a response to a ""Task"" that may be a letter, a report, or a speech to an interested group. In the written response they must refer to both...
Curated OER
Making a Spreadsheet
Students explore spreadsheet software. In this personal finance and computer technology lesson plan, students develop a vacation spreadsheet on the computer. Students represent hotel, food, transportation, and entertainment...
Curated OER
Spreadsheet Function Machine
Learners create a spreadsheet to analyze functions. For this algebra lesson, students use spreadsheets to find the intersection of systems of equations. They identify the dependent and independent function as it relates to a line.
Curated OER
Comparing Temperature, Pressure, and Humidity
Students investigate data on temperature, pressure, and humidity by downloading information from the ARM Website. Working in groups, they discover how weather impacts life in each of the ARM sites. They record weather data in their...
Curated OER
NCAA Basketball finals
Young scholars read and interpret graphs of data sets. The data is used to devise reasons as to why teams in the NCAA Basketball finals from the 1950'sand up have the highest scores.
Curated OER
The Distributive Property
Students review how to solve problems using the Distributive Property of Mathematics. They solve problems using the paper and pencil method and then use the graphing calculator to discover the property over addition while making a visual...
Curated OER
Polynomial Functions
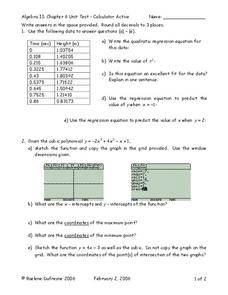
In this Algebra II worksheet, 11th graders use a graphing calculator to determine the regression equation of the given data, graph polynomial functions, factor polynomials, and determine the quotient and remainder in polynomial division....
Curated OER
Even and Odd Numbers
First graders use patterns in order to identify and recognize even and odd numbers.
Curated OER
Do Vampires Really Exist?
Students identify and extend a number pattern into very large values. They create and interpret a graph based on their number patterns. Students compare a math model with real-world statistics about the existence of vampires.
Curated OER
Family Vacation
Students use math to plan a trip by houseboat down the Mississippi River. They research and obtain information on the Mississippi River and its surroundings and use multiple graphs to represent their data.
Curated OER
Integration and the "Barrier Breakers": Black Baseball 1945-1960
High schoolers explore integration of Major League Baseball, identify important individual baseball players who played key roles in integration, and analyze historical information through charts, graphs, and statistics.
