CK-12 Foundation
Interpretation of Circle Graphs: Northwest Region Population Pie
Given populations of the five Northwestern states, learners create a circle graph. Using the data and the pie chart, they make comparisons between the populations of the states. Finally, the pupils determine how the chart will change...
Curated OER
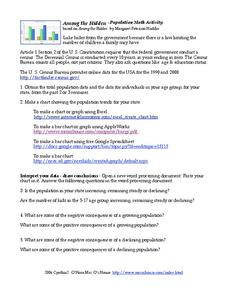
Among the Hidden - Population Math Activity
In this population worksheet, students collect data on population by researching the Census Bureau and then make online graphs and answer short answer questions about the data. Students complete 5 problems total.

