Hi, what do you want to do?
Curated OER
Do Vampires Really Exist?
Students identify and extend a number pattern into very large values. They create and interpret a graph based on their number patterns. Students compare a math model with real-world statistics about the existence of vampires.
Curated OER
Patterns of Settlement in Early Alabama
Fourth graders study the settlement of Alabama. They collect data from the U.S. census website and answer questions regarding settlement patterns in the counties of Alabama in 1820. They write a paagraph describing where they would have...
Curated OER
Making a Cartogram
Learners interpret statistical geographic information by creating a cartogram.
Curated OER
The Great Migration: Pushed By The South, Pulled By The North
Students identify key features of the Great Migration. They explain the concepts of push and pull factors for migration. They create an art project which shows an understanding of the push and pull factors.
Curated OER
Population Pyramids
Learners explain the significance of population trends on world regions. They define relevant population vocabulary and examine age-gender patterns at various scales.
Curated OER
Learning and Population Information - Where I Live
Learners study their county populations in a multimedia presentation format. In this populations lesson, students work in groups of 3 to research the county populations in their state. Learners chart their results in an Excel document...
Curated OER
Population Pyramid
Students learn about demographic population pyramids. They then design and fictitious nation and draw its population pyramid.
Curated OER
Bullying-studying it to curb it....
Students will engage in a variety of research activities to write what the latest facts are concerning the issue of bullying. This issue is relevant to the lives of learners in schools, which will make for an high interest lesson.
Curated OER
Lesson 3: Understanding Population Growth
Students explain population growth in Maryland and its relationship with age structure, household growth and consumption of land.
Curated OER
Free African-Americans in Delaware
Pupils work in groups of two and review the Abolitionist Movement. They observe the manumission/city directory and discover what it is and why it is so important. They read the manumission aloud and discuss why they were freeing their...
PBS
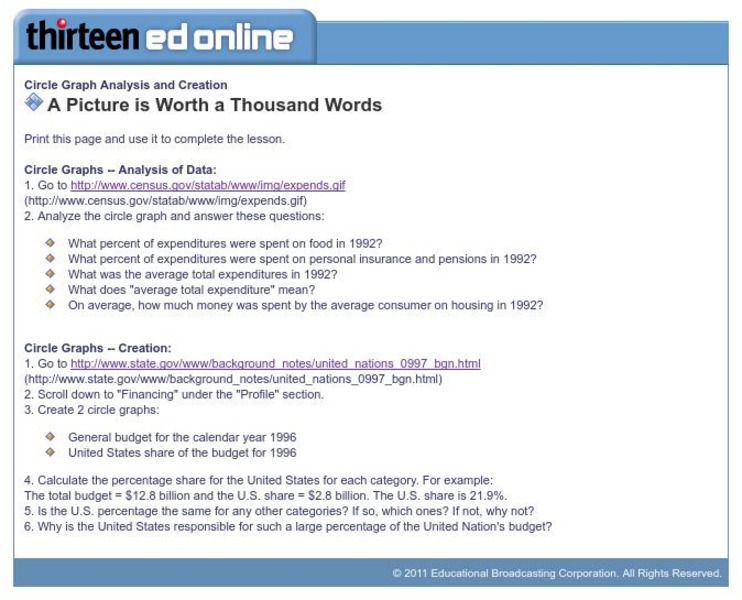
Wnet: Thirteen: Circle Graph Analysis and Creation
This site, which is provided for by WNET, gives a great way to practice using circle graphs through these exercises. One is analyzing a pie graph from the Census Bureau and the other creating pie charts using government data.


