Curated OER
Then and Now
Students conduct research and use census data to compare different times and places. In this census instructional activity, students interpret data from charts and graphs, comparing census information from two time periods as well as...
American Statistical Association
Bear Hugs
Scholars research arm span to determine who gives the best bear hugs. They use data from a national study to find the standard statistics for arm span. It includes mean, median, quartiles, spread, standard deviation, and more.
Curated OER
ou are the Researcher!
Students conduct a census at school. They collect data, tally it, and create a frequency table. Students display their data in three different types of graphs. They write complete sentences describing the graph.
American Statistical Association
Armspans
Young mathematicians collect data on the arm spans of classmates. Then they sort the data by measures of center, spread, and standard deviation. Finally, they compare groups, such as boys and girls, to interpret any differences.
Curated OER
Population Pyramids
Young scholars work with and make population pyramids. In this population pyramid lesson, students use census data to make population pyramids for China, India, and the United States. They use the information to determine why jobs are...
Curated OER
Role-Playing Jean Talon
Students explore New France. In this New France lesson, students examine census data compiled by Jean Talon in 1665 and 1666. Students take on the role of Talon trying to convince the King of France to increase his investment in New...
Bowland
Fashionista
So trendy! Show your class how to identify trends in sales patterns using mathematics. Scholars use a software simulation to collect data on age groups, price, and sales at a fashion store. This data allows individuals to determine the...
Curated OER
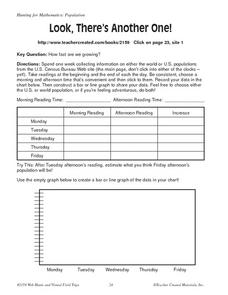
Look, There's Another One!
In this math worksheet, students spend a week collecting information on either the word or U.S. populations from the U.S. Census Bureau Web site. Students record their data in a chart and bar graph. Students also use the website to...
Curated OER
Ohio Census 1990 and 2000
Students explore the Ohio census numbers in 1990 and 2000. In this social studies lesson, students use the census data to answer questions.
Curated OER
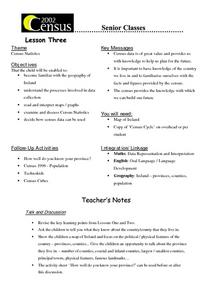
Census Statistics
Twelfth graders become familiar with the geography of Ireland. They explore the processes involved in data collection. Students examine and discuss Census Statistics and read and interpret maps/graphs. They decide how the census data can...
Curated OER
Time Changes Everything
Students analyze census data from 1915, 1967 and 2006. They read an article about how the world's population is growing at an alarming rate. They use primary source documents to create a timeline on the information they gathered. They...
Illustrative Mathematics
Electoral College
A cross-curricular resource that takes the electoral votes and allows your learners to organize and analyze the data. Young voters can determine which states are more influential and interpret the dotplot provided for more data....
Curated OER
Surname Survey
Students use data from the U.S. Census Bureau to determine whether last names in a local phone directory reflect the Census Bureau's list of the most common surnames in the country. In this surnames lesson plan, students use the Internet...
Curated OER
Meatiest States: Graph Problem Solving
In this graph problem solving learning exercise, students analyze a graph that shows commercial red meat production in five states. Students answer 5 word problems using the data on the graph.
Curated OER
Census Data and New Hampshire History
Learners graph the population growth of New Hampshire using historical census data.
Curated OER
Census Sensibility
Students examine the importance of the census and census data collection methods. They gather statistical data, create graphs comparing state and national populations, and compose written reflections on why the census is necessary.
Curated OER
Graphs! Graphs! Graphs!
Learners practice making charts and graphs from data on spreadsheets. Individually, they create a graph representing the latest information on voter registration. They answer questions and analyze the data to end the lesson.
Curated OER
Education for Global Peace
Fifth graders construct data graphs based upon sets of data. In this graphing lesson, 5th graders read the text If the World Were a Village and discuss how types of graphs accurately represent a large population. Students construct their...
Curated OER
Linguistic Diversity. Languages in Canada - Elementary
Create a language mosaic to reveal the linguistic diversity in your community. Pupils interview a person with a home language other than English and contribute to a bulletin board display representing the variety of languages spoken. The...
Curated OER
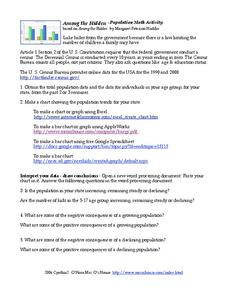
Among the Hidden - Population Math Activity
In this population worksheet, students collect data on population by researching the Census Bureau and then make online graphs and answer short answer questions about the data. Students complete 5 problems total.
Curated OER
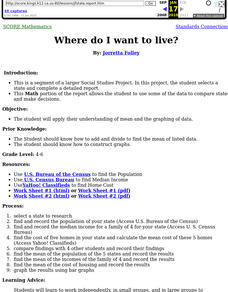
Where Do I Want To Live?
Students use a variety of Internet sources to gather income, population and housing data. Each group bring their results to the class and the class use their findings to compile mean population, income, and housing for all states.
Curated OER
Being an Educated Consumer of Statistics
Students examine kinds of data used to report statistics, and create their own statistical report based on any of the four sources of media information (Internet, newspaper, TV, magazine).
Curated OER
Getting There
Students practice reading a pictograph. In this data analysis lesson, students collect data and create their own pictograph. A students worksheet is included.
Curated OER
Census Statistics and Graphing
Students graphically represent data from the Census. For this middle school mathematics lesson, students investigate the housing characteristics of different tribes of Native Americans and compare them to the average American...


