Mathigon
Mathigon: Graphs and Networks: Parties and Dating
This lesson uses handshakes at a party to explain complete graphs, when every vertex is connected to every other vertex. It shows how a formula was created to calculate the number of edges.
Better Lesson
Better Lesson: Using Area as an Architect (Stations Day 1)
In this multi-day activity, 3rd graders make 3 different models of an orphanage floor plan using Google Drawing, Virtual Graph paper, and a construction of rectilinear shapes, to calculate the area of each room using units square.
Varsity Tutors
Varsity Tutors: Hotmath: Graphing Calculator Practice Problems: Geometry
Practice using your graphing calculator for geometry problems, including the use of the Pythagorean Theorem and the distance formula. If you get stumped or if you would like to check your work, then select the View Solution button, which...
Texas Instruments
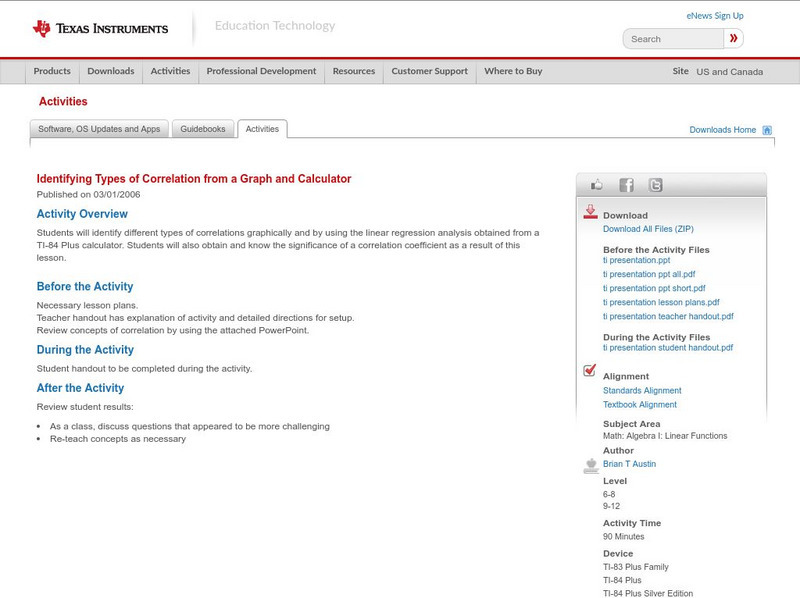
Texas Instruments: Identifying Types of Correlation From a Graph and Calculator
Students will identify different types of correlations graphically and by using the linear regression analysis obtained from a TI-84 Plus calculator. Students will also obtain and know the significance of a correlation coefficient as a...
Oswego City School District
Regents Exam Prep Center: Solving Systems Using Addition or Subtraction
Three examples are used to demonstrate solving a system of linear equations algebraically using addition and subtraction. The examples cover different situations that occur with the coefficients of the variable terms. Includes several...
CK-12 Foundation
Ck 12: Algebra: Solving Linear Systems Using Matrices and Technology
[Free Registration/Login may be required to access all resource tools.] This lesson covers using a graphing calculator and matrices to solve a system of equations.
CK-12 Foundation
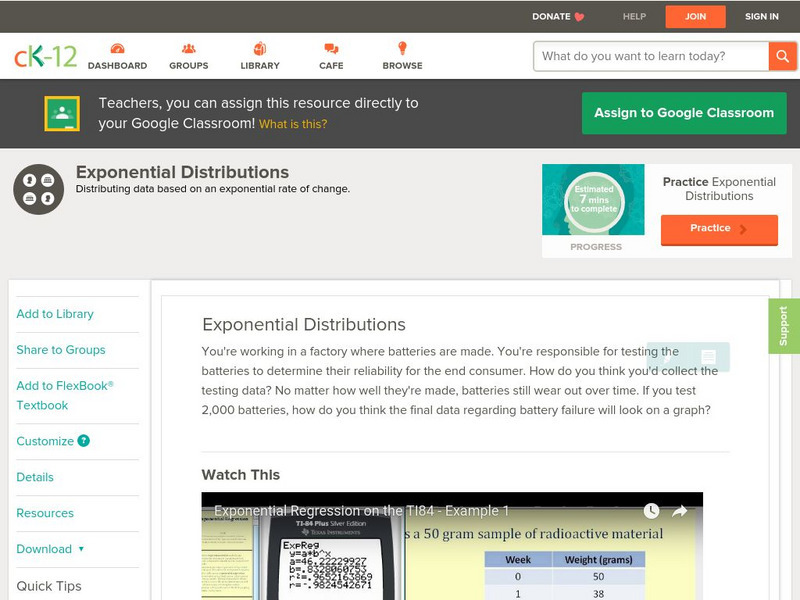
Ck 12: Probability: Exponential Distributions
[Free Registration/Login may be required to access all resource tools.] Covers exponential distributions. Presents examples using a graphing calculator as well as guided and independent practice questions.
University of South Florida
Fcat: Get a Half Life!: Teacher Notes
Learners use M&M's and a graphing calculator to collect and graph data. This activity helps them to understand exponential functions and the concept of half-life.
PBS
Pbs Teachers: Supersonic Dream
Examine how fuel use affects the mass of different planes during flight. This activity teaches students how to determine the per person fuel cost of a transatlantic flight for seven airplanes, and display the results on a bar graph....
Texas Education Agency
Texas Gateway: Solving Linear Equations and Inequalities
When given a table, equation or verbal description, students will solve one- and two-variable equations and inequalities using algebraic steps or graphing methods.
Teachnology
Teachnology: Math Lesson Plans
Great lesson plans covering a wide-range of math-related subjects.
PBS
Pbs Teachers: Building Boxes [Pdf]
By determining the dimensions necessary for building a box with the greatest volume, young scholars will explore the world of polynomial and rational expressions. Graphing calculators can be used for this activity.
CK-12 Foundation
Ck 12: Probability: Theoretical and Experimental Probability
[Free Registration/Login may be required to access all resource tools.] Here you'll learn about theoretical and experimental probability, including how to describe sample spaces and how to conduct probability simulations. Includes...
Alabama Learning Exchange
Alex: My Peanut Butter Is Better Than Yours!
The students will engage in the process of statistical data comparing data using tables and scatterplots. The students will compare data using measures of center (mean and median) and measures of spread (range). This lesson can be done...
Oswego City School District
Regents Exam Prep Center: Systems of Linear Inequalities
Solving a system of linear inequalities is shown to be as easy as solving a system of linear equations! An example is explained before students are given several problems to complete on their own. Complete explanations of these are...
Oswego City School District
Regents Exam Prep Center: Multiple Choice Practice: Probability
Test your knowledge of probability by taking this twenty question multiple-choice practice test. Use a graphing calculator to help with any graphing problems and check your answers at any given time throughout the test.
Purple Math
Purplemath: Solving Polynomials: How To
Demonstrates the steps involved in solving a general polynomial, including how to use the Rational Roots Test and synthetic division. Points out when using a graphing calculator can be very helpful.
TeachEngineering
Teach Engineering: Falling Water
Students drop water from different heights to demonstrate the conversion of water's potential energy to kinetic energy. They see how varying the height from which water is dropped affects the splash size. They follow good experiment...
TeachEngineering
Teach Engineering: Cost Comparisons
Students learn about the many types of expenses associated with building a bridge. Working like engineers, they estimate the cost for materials for a bridge member of varying sizes. After making calculations, they graph their results to...
TeachEngineering
Teach Engineering: Stack It Up!
Students analyze and begin to design a pyramid. Working in engineering teams, they perform calculations to determine the area of the pyramid base, stone block volumes, and the number of blocks required for their pyramid base. They make a...
CK-12 Foundation
Ck 12: Plix Series: Uniform Acceleration
[Free Registration/Login Required] Using the average acceleration formula, calculate the velocity of a falling ball, and then check your answer by dragging the point along the line in the given graph. After the activity, answer one...
Alabama Learning Exchange
Alex: Jump!!! An Exploration Into Parametric Equations
Students will use vectors and parametric equations to determine the velocity that they should jump out of the window of a burning building in order to land safely into the rescue net. They will work in small groups and utilize graphing...
Khan Academy
Khan Academy: Lesson Summary: Supply and Its Determinants
In this activity summary review and remind yourself of the key terms, graphs, and calculations used in the analysis of supply. Topics include the distinction between supply and quantity supplied, the law of supply, and the determinants...


