Calculator Soup
Calculator Soup: Descriptive Statistics Calculator
This is a statistics calculator; enter a data set and hit calculate. Descriptive statistics summarize certain aspects of a data set or a population using numeric calculations. Examples of descriptive statistics include: mean, average,...
Varsity Tutors
Varsity Tutors: Hotmath: Graphing Calculator Practice Problems Areas and Volumes
Practice using your graphing calculator for area and volume problems. If you get stumped or if you would like to check your work, then select the View Solution button, which is located directly under each problem.
Smithsonian Institution
National Museum of American History: Slates, Slide Rules and Software
Did you learn to calculate using a 7-foot-long slide rule? Did you learn about the properties of numbers using brightly colored Cuisenaire rods? Ever wonder who invented the graph paper you used in geometry class? Go back to the...
Illustrative Mathematics
Illustrative Mathematics: F If.6 Mathemafish Population
For this task, learners are presented with a table and a graph and are asked to summarize the data and report the findings of a project by the Environmental Protection Agency to contain the effects of an invasive species on a fish...
TeachEngineering
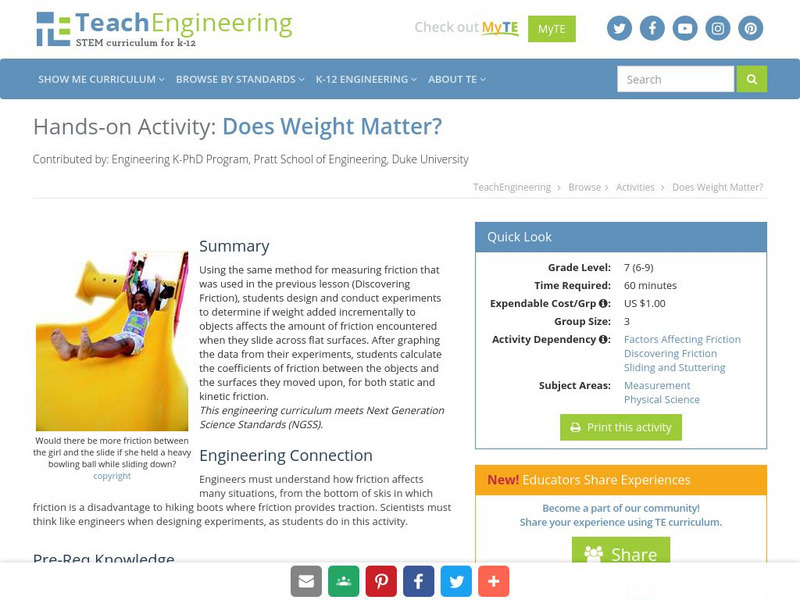
Teach Engineering: Does Weight Matter?
Using the same method for measuring friction that was used in the previous lesson (Discovering Friction), students design and conduct an experiment to determine if weight added incrementally to an object affects the amount of friction...
Khan Academy
Khan Academy: Lesson Summary: Demand and the Determinants of Demand
In this lesson summary review and remind yourself of the key terms, graphs, and calculations used in analyzing the demand for the good. Review the distinction between demand and quantity demanded, the determinants of demand, and how to...
Illustrative Mathematics
Illustrative Mathematics: 6 Sp.2,5d Electoral College
In addition to providing a task that relates to other disciplines (history, civics, current events, etc.), this task is intended to demonstrate that a graph can summarize a distribution as well as provide useful information about...
Texas Instruments
Texas Instruments: Discovering Ohm's Law
In this activity, students use voltage and current probes to investigate Ohm's Law. The students collect data and use their graphing calculators to perform data analysis and "discover" Ohm's Law.
Texas Instruments
Texas Instruments: Election Night With Percent
The students will be working primarily with the concept of % of a number. They will calculate the number of people expected to vote when given the population and % of registered voters along with historical data on percentage of voter...
PBS
Pbs: Real World Proportional Relationships: Gender Wage Gap
Using this infographic, learn how wage equity today compares with data from 50 years ago, at the dawn of the equal pay movement. The accompanying classroom activity invites students to explore the change in the gender wage gap from 1965...


