Curated OER
Weather Report Chart
Students complete a weather report chart after studying weather patterns for a period of time. In this weather report lesson, students measure temperature, precipitation, cloud cover, wind speed, and wind direction for a month. Students...
Curated OER
Creating a Mathematical Model Using Weather Data
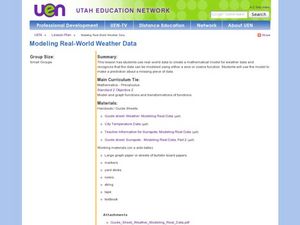
Students explore the concept of mathematical models. In this mathematical model lesson, students create a mathematical model from data from 4 cities over 15 months. Students are told they are working for a weather station. Students...
Curated OER
Temperature Bar Graph
Students explore mean, median and mode. In this math lesson, students analyze temperature data and figure the mean, median, and mode of the data. Students graph the data in a bar graph.
Curated OER
Weather Calendar
In this weather calendar activity, learners read the calendar and identify the type of weather that occurred on that date. They also determine the total number of days that were cloudy, sunny, etc. There are 9 questions on this...
Curated OER
Observing and Predicting Weather from a Weather Station
Fourth graders us a Weather Log data chart to record the date, time, day, and weather. They discuss different instruments and charts needed to record the information. Students turn in their weather logs at the end of two weeks and...
Curated OER
Weather or Not
Sixth graders explore weather. In this meteorology lesson, 6th graders create weather instruments and compare and contrast weather data.
Curated OER
Weather the Storm
Fourth graders complete multi-curricular activities for weather. In this weather lesson, 4th graders complete creative writing, research, and weather data analysis activities for the lesson.
Curated OER
Making Graphs
Students explore statistics by conducting class demographic surveys. In this graph making instructional activity, students identify the family members of each classmate, pets they own, and favorite activities. Students organize their...
Curated OER
Line Graphs 4
In this graph worksheet, students interpret given line graphs. They determine the range, and identify the range in a set of data. This one-page worksheet contains approximately 14 problems.
Curated OER
Graphs
Pupils participate in a lesson plan exploring the concept of using graphs in various types of mathematical problems. They use negative and positive numbers in order to plot a graph. Students should use a place value chart for a reference...
Curated OER
The Hudson's Ups and Downs
Even rivers have tides. Older elementary schoolers will discuss the Hudson River and how weather, water craft, and the ocean cause tidal fluctuation. They will examine a series of line graphs that depict tidal fluctuation, then analyze...
Curated OER
Cloudy vs. Clear
Learners analyze line plots. In this weather lesson plan using real NASA data, students discuss how weather affects the way the Earth is heated by comparing different line plots.
Curated OER
Settlement Exploration: Then and Now
NASA has crafted an imaginative and memorable series of lessons, "NASA and Jamestown Education Module." This lesson is one of the five components. In it, middle schoolers connect history and science by comparing the settlement of...
NASA
The Big Climate Change Experiment Lesson 3: Climate Change Lines of Evidence
Consider the preponderance of evidence when making a verdict. The third of five lessons in Unit 1: The Big Climate Change Experiment focuses on the evidence for climate change. Learners study graphs, diagrams, and pictures regarding...
Illustrative Mathematics
How is the Weather?
This activity asks learners to interpret data displayed on a graph within the context of the problem. Students are given three graphs that show solar radiation, or intensity of the sun, as a function of time. They are also given three...
Curated OER
How's The Weather?
Students make a box and whiskers plot using the TI-73 graphing calculator. Each student would have their own calculator but they would work in small groups of two or three to help each other enter the data and make the plots.
California Mathematics Project
Meteorology
See how estimation is essential to making temperature weather maps. Scholars use ratios and rates of change to estimate temperatures at locations where temperature readings have not been made. They connect this idea to linear functions.
Curated OER
The Air Up There
In this data collection and analysis lesson, students observe and graph the weather conditions during one school week, then calculate the average weather temperature. Extensions are included.
Curated OER
Graphing Changes in Weather
Students graph current temperature and weather conditions for three days. In this weather lesson, students go to the Weather Channel's website and look up weather for their zip code then graph the conditions and record the current...
Curated OER
Weather v. Climate
Ninth graders discuss the differences between climate and weather as a class. Using data they collected, they create a graph of the data to share with the class over a specific time period. They compare and contrast this data with...
Curated OER
Which Kind of Weather Do You Like Best? -- Class Bar Graph
In this math worksheet, students generate a class bar graph. Classmates are surveyed about favorite weather: sunny, rainy, snowy, cloudy or windy. Results are displayed on a bar graph.
Curated OER
Weather Conditions
In this weather conditions worksheet, students use a month of recorded weather conditions to create a graph comparing the number of days it was cloudy, raining, or clear. This worksheet has a graphic organizer and a graph.
Curated OER
Graphing and Analyzing Biome Data
Students explore biome data. In this world geography and weather data analysis instructional activity, students record data about weather conditions in North Carolina, Las Vegas, and Brazil. Students convert Fahrenheit degrees to Celsius...
Other popular searches
- Graphing Weather Data
- Graphing Weather Activity
- Weather Graphing
- Weather Graphing Temperature
- Weather Graphing Probability


