Royal Society of Chemistry
Royal Society of Chemistry: The Periodic Table of Data
An interactive Periodic Table of Elements which also serves as a visual database of each element's physical and thermochemical properties. Online activities include virtual graphing, tables of data, energy level diagrams, games, and more.
Other
Online Statistics Education: Graphing Distributions [Pdf]
This is the second chapter of a statistics e-text developed collaboratively by Rice University, University of Houston Clear Lake, and Tufts University. It looks at many different types of data displays and the advantages and...
Government of Alberta
Learn Alberta: Math Interactives: Exploring Data Display and Graphs
This multimedia Learn Alberta math resource focuses on graphing data. In the video portion, students will see how math is involved in the display of merchandise in stores. The accompanying interactive component provides an exploration...
McGraw Hill
Glencoe: Self Check Quizzes 1 Frequency Tables
Use Glencoe's randomly generated self-checking quiz to test your knowledge of frequency tables. Each question has a "Hint" link to help. Choose the correct answer for each problem. At the bottom of the page click the "Check It" button...
Other
Algebra Class: Solving and Graphing a Quadratic Equation
Math teacher provides a unit on quadratic equations in which she explains the concepts of solving and graphing quadratic equations through numerous examples and graphs. Hyperlinks are available to each step that ultimately leads to...
Texas Education Agency
Texas Gateway: Evaluating Data in Tables, Graphs and Charts
[Accessible by TX Educators. Free Registration/Login Required] In this lesson students look at examples of graphics, tables, charts, and graphs, and learn how to interpret their data. They will be able to use this skill to enhance their...
Texas Education Agency
Texas Gateway: Informational Text: Synthesize Information in Charts and Graphs
In this lesson, you will learn how to understand the data found in charts and graphs, and at the end of the lesson, you will practice what you have learned.
BBC
Bbc Skillswise: Graphs: Lists and Tables
Resource shows how to use lists and tables to organize information.
CK-12 Foundation
Ck 12: Statistics: Line Graphs Grade 7
[Free Registration/Login may be required to access all resource tools.] Make a line graph to display data over time.
Khan Academy
Khan Academy: Creating Frequency Tables
Practice creating frequency tables from small data sets. Students receive immediate feedback and have the opportunity to try questions repeatedly, watch a video or receive hints.
CK-12 Foundation
Ck 12: Statistics: Bar Graphs Grade 7
[Free Registration/Login may be required to access all resource tools.] Make a bar graph to display given data.
CK-12 Foundation
Ck 12: Statistics: Bar Graphs Grade 8
[Free Registration/Login may be required to access all resource tools.] Students will interpret data to understand given bar graphs.
CK-12 Foundation
Ck 12: Algebra: Graphs of Square Root Functions
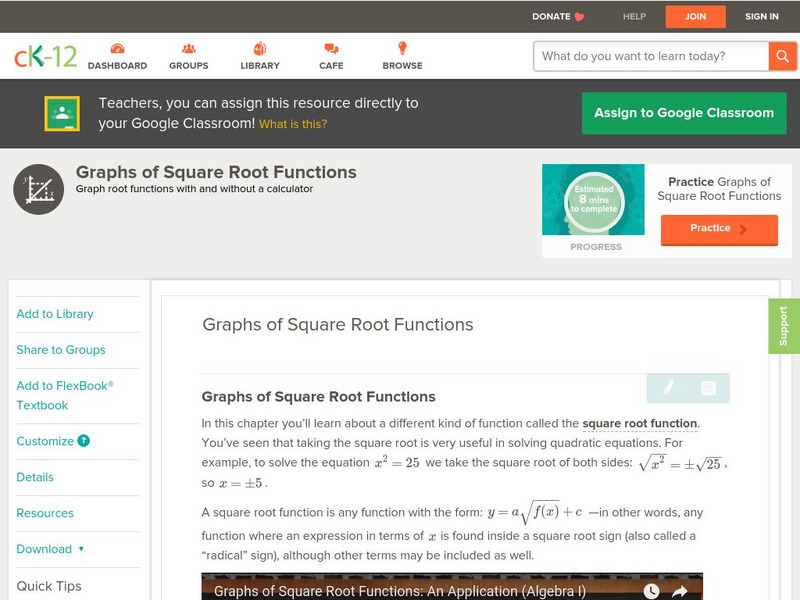
[Free Registration/Login may be required to access all resource tools.] Given a function that involves a square root, make a table of values to graph it in the coordinate plane.
CK-12 Foundation
Ck 12: Algebra: Graphs of Linear Equations
[Free Registration/Login may be required to access all resource tools.] Students learn how to graph linear equations. Students examine guided notes, review guided practice, watch instructional videos and attempt practice problems.
Better Lesson
Better Lesson: Fast Food Freddie Surveys and Bar Graphs
Students continue to build their graphing skills. They experience a real world application of graphing by organizing survey results.
CK-12 Foundation
Ck 12: Statistics: Circle Graphs to Display Data Grades 6 7
[Free Registration/Login may be required to access all resource tools.] Here you'll display data by using a circle graph.
CK-12 Foundation
Ck 12: Statistics: Line Graphs to Display Data Over Time
[Free Registration/Login may be required to access all resource tools.] Create line graphs to display how data changes over time.
CK-12 Foundation
Ck 12: Statistics: Bar Graphs Grades 9 10
[Free Registration/Login may be required to access all resource tools.] Make a bar graph to display given data.
Texas Instruments
Texas Instruments: Linear Equations: Using Graphs and Tables
Students learn to locate the real number solution of a linear equation using tables. They also learn to locate the real number solution of a linear equation using graphical method on a Cartesian (x-y) graph.
E-learning for Kids
E Learning for Kids: Math: Tea Store: Reading a Table
Students will demonstrate how to interpret information in a table.
US Department of Education
Nces Kids: Create an Xy Graph
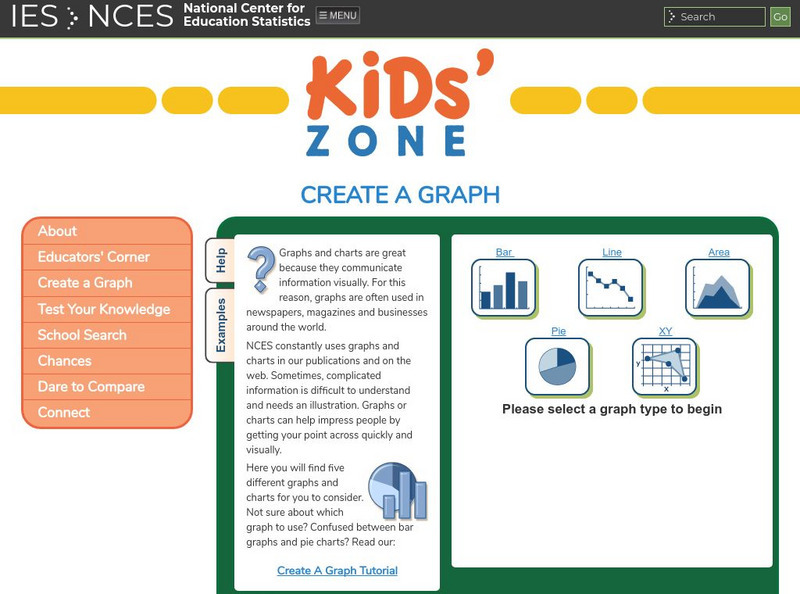
This is where you can find a step by step explanation of how to create an XY graph. When you finish each step just click the next tab and you will find the next set of instructions.
BBC
Bb Ci: Exponential Graphs (Higher)
Exponential graphs increase rapidly in the Y direction and will never fall below the X -axis, thus forming a curve.
E-learning for Kids
E Learning for Kids: Math: Wizards: Graphs
Join the Magic Wandia Games and learn all about graphs!
Houghton Mifflin Harcourt
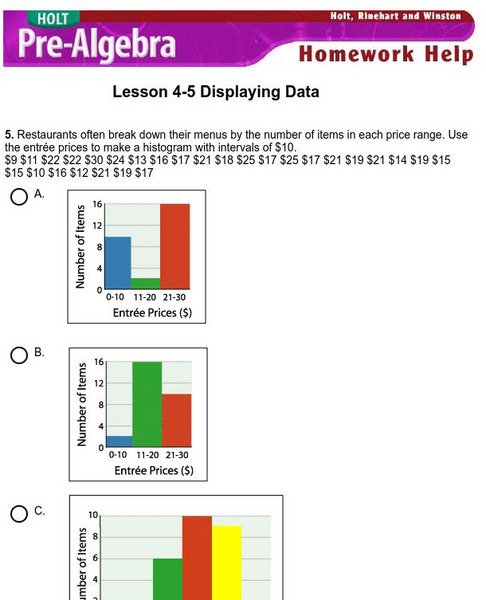
Holt, Rinehart and Winston: Homework Help Independent Practice: Displaying Data
Get independent practice displaying data. Each incorrect response gets a text box explanation and another try. Correct responses are confirmed.


