Scholastic
Scholastic: Bars, Lines, and Pies
Students will learn and reinforce skills for creating, applying and analyzing pie charts, bar graphs and line graphs.
Illustrative Mathematics
Illustrative Mathematics: F if.c.7.a, a sse.b.3, F if.c.7: Graphs of Quadratic
During this task, students will realize that equivalent expressions produce the same graph. The lesson plan will lead to discussions about the value of different forms of equations. Aligns with F-IF.C.7.a, A-SSE.B.3, and F-IF.C.7.
Illustrative Mathematics
Illustrative Mathematics: F Le Comparing Graphs of Functions
The goal of this task is to use appropriate tools to compare graphs of several functions. In addition, students are asked to study the structure of the different expressions to explain why these functions grow as they do. Aligns with...
Other
Slu: Graphing Polar Equations Lesson Plan
A lesson plan for graphing polar equations. The students work in groups to graph groups of polar equations and answer questions concerning these classic curves. After discussing the answers, the students are then required to develop...
University of Texas
Inside Mathematics: Granny's Balloon Trip [Pdf]
This task challenges a student to use knowledge of scale to organize and represent data from a table on a graph.
Alabama Learning Exchange
Alex: Jelly Beans Add Up
The lesson will explore counting, sorting, and graphing skills. The lesson provides students an exciting and fun way of exploring and internalizing graphing, sorting, and counting skills. Realistically, the students will discover what...
Other
Study.com: Critical Path Analysis
Critical path analysis is a project management tool used to understand task dependencies and their effect on the project schedule. In this lesson, we show how the critical path can be derived
University of Texas
Inside Mathematics: Parking Cars [Pdf]
This task challenges a student to use their understanding of scale to read and interpret data in a bar graph.
CPALMS
Cpalms: Dollars for Density
This is a guided inquiry activity in which students use simple lab procedures and discussions to develop and apply the concept of density. Students collect and graph data which they use to explore the relationship between mass and...
Howard Hughes Medical Institute
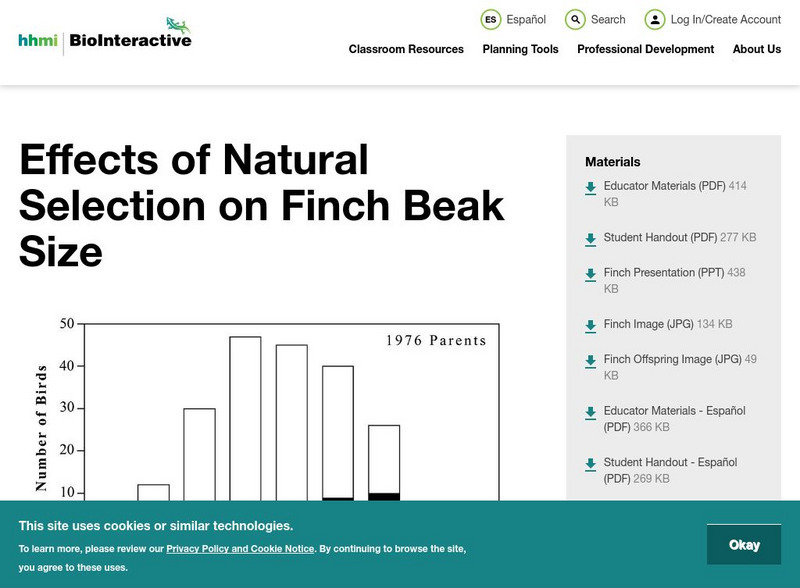
Hhmi: Bio Interactive: Effects of Natural Selection on Finch Beak Size
In this activity, students examine research on finches on the island of Daphne Major in the Galapagos Islands. The depth of the finches' beaks was measured before and after a drought. This data is displayed in graphs and students are...
NASA
Nasa: Precipitation Towers: Modeling Weather Data
This instructional activity uses stacking cubes as a way to graph precipitation data, comparing the precipitation averages and seasonal patterns for several locations. Variations on the instructional activity can accommodate various ages...
Khan Academy
Khan Academy: The Market for Loanable Funds Model
This study resource will help students understand, and create, graphs that are critical skills in macroeconomics. This article reviews the loanable funds model. This resource is designed as a review for the AP Macroeconomics Test or a...
Khan Academy
Khan Academy: The Aggregate Demand Aggregate Supply (Ad As) Model
This study resource will help learners understand, and create, graphs that are critical skills in macroeconomics. This article reviews the aggregate demand-aggregate supply (AD-AS) model.This resource is designed as a review for the AP...
Illustrative Mathematics
Illustrative Mathematics: Favorite Ice Cream Flavor
The purpose of this task is for students to represent and interpret categorical data. As a class, students will answer a question with three possible answers and construct a bar graph with the responses. Multiple discussion questions and...
Council for Economic Education
Econ Ed Link: Focus on Economic Data: The Inflation Rate
Explore the inflation rate from 2013 through this informative case study. Trace the consumer trends through the graphs and charts on the site.
Alabama Learning Exchange
Alex: Representing Possibilities
The students will work through problems that will be represented in tables, equations, and graphs. This lesson was adapted from NCTM Student Math Notes, May/June 2007.This lesson plan was created as a result of the Girls Engaged in Math...
Alabama Learning Exchange
Alex: Statistically Thinking
The object of this project is for young scholars to learn how to find univariate and bivariate statistics for sets of data. Also, the students will be able to determine if two sets of data are linearly correlated and to what degree. The...
PBS
Pbs Teachers: Escape! Because Accidents Happen: Car Crash
Examine the benefits and risks of using seat belts and analyze national statistics on seat belt use. Design and implement a study of local seat belt use and compare the results to the national statistics.
PBS
Pbs News Hour: Unemployment
This PBS lesson plan incorporates math, language arts, and economics to study the current unemployment situation in our country. Students begin by watching a story from NewsHour with Jim Lehrer, then create a publication to showcase...
Alabama Learning Exchange
Alex: Wheels All Around
Students will use skip counting to see how many wheels visit the school during specified times in one day. This lesson plan was created as a result of the Girls Engaged in Math and Science University, GEMS-U Project.
Alabama Learning Exchange
Alex: Heart Line Express
During this lesson, students will plan and execute a week-long school-wide valentine sales business. From the Grand Plan to job applications, interviews, valentine production, advertising, sales and profits students are immersed in the...
University of Texas
Inside Mathematics: Our Pets [Pdf]
This task challenges a student to demonstrate understanding of concepts involved in representing and interpreting data.
Alabama Learning Exchange
Alex: "Nuts" About Peanuts! (Reading)
The lesson will be implemented as part of a unit about plants. The students will learn about the growth cycle of a peanut and use a Five-Step Sequence Think-sheet to sequence the steps. They will also make predictions and complete...
TeachEngineering
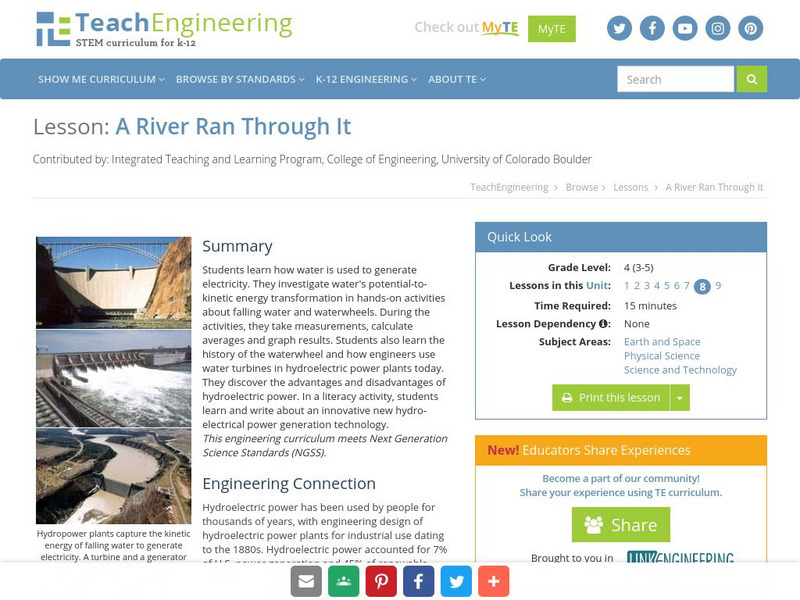
Teach Engineering: A River Ran Through It
Students learn how water is used to generate electricity. They investigate water's potential-to-kinetic energy transformation in hands-on activities about falling water and waterwheels. During the activities, they take measurements,...
Other popular searches
- Graphing Skills Lesson Plans
- Basic Graphing Skills
- Organizing and Graphing Data
- Introducing Graphing Skills
- Graphing Skills Using M&ms
- Graphing Skills in Science
- Graphing Skills for Prek
- Graphing Skills With Fruits
- Graphing Skills in Chemistry
- Graphing Skills for Perk
- Graphing Skills Worksheet
- Reading Graphing Skills


![Inside Mathematics: Granny's Balloon Trip [Pdf] Lesson Plan Inside Mathematics: Granny's Balloon Trip [Pdf] Lesson Plan](https://d15y2dacu3jp90.cloudfront.net/images/attachment_defaults/resource/large/FPO-knovation.png)


