Better Lesson
Better Lesson: Fast Food Freddie Surveys and Bar Graphs
Students continue to build their graphing skills. They experience a real world application of graphing by organizing survey results.
TeachEngineering
Teach Engineering: Complex Networks and Graphs
Students learn about complex networks and how to represent them using graphs. They also learn that graph theory is a useful mathematical tool for studying complex networks in diverse applications of science and engineering, such as...
University of Canterbury
University of Canterbury: Cs Unplugged: Graph Colouring
Introduce graph coloring, and lead students on to many variations and extensions that reach the cutting edge of computer science.
Better Lesson
Better Lesson: Graphing Our Snack Mix: Review of Graphing
Second graders review how to make bar graphs, line plots, and pictographs by tallying the contents of snack mix and building graphs to show their data.
Can Teach
Can Teach Lesson Plan: Graphing Constellations
In this lesson plan, students practice their graphing skills by following directions to recreate constellations.
Other
Elmwood Park High School: Vertex Edge Graphs
In this Unit, you will use vertex-edge graphs and Euler Circuits to help find optimum paths. Included are two lessons that help you develop the understanding and skill needed to solve problems about optimum paths and conflicts.
Science Education Resource Center at Carleton College
Serc: Investigating Motion Graphing Speed
In this introduction to motion activity, students will get a personal understanding of speed and acceleration by experiencing it firsthand. Wheeled office chairs or other cart like devices are used to give one student a ride as a fellow...
Better Lesson
Better Lesson: Graphing January's Weather
First graders graph the weather in Vermont for the month of January.
Better Lesson
Better Lesson: Graph Party
First graders will be involved in creating three different types of graphs and then be asked to answer questions about each representations data set.
Alabama Learning Exchange
Alex: Getting to Know Your Classmates Using Bar Graphs
Middle schoolers will collect data from class using surveys. Students survey classmates concerning favorite movies, favorite color, shoe size, time spent studying, brand of cell phone and etc. From the data they will create bar graphs...
Alabama Learning Exchange
Alex: Misleading Graphs Are Da'pits!
In this interactive lesson, students will discover how creating an incorrect graph will display misleading information. Through viewing and discussing a variety of graphs, the students will identify 5 components that graphs must contain...
Science Education Resource Center at Carleton College
Serc: Mass Spectrometry: Using a Game Format to Develop Logic Skills
Students will use previous knowledge of chemistry concepts and skills to interpret mass spectrometry graphs and will learn to determine one or more possible formulas for an organic molecule represented on the graph. They will also gain...
Smithsonian Institution
Smithsonian in Your Classroom: Teaching With Collections [Pdf]
This instructional activity is great for young learners who like to collect things. It gives you ideas of ways to teach such concepts as classifying, sorting, arranging, multiplying, graphing, and measuring with collections of simple...
TeachEngineering
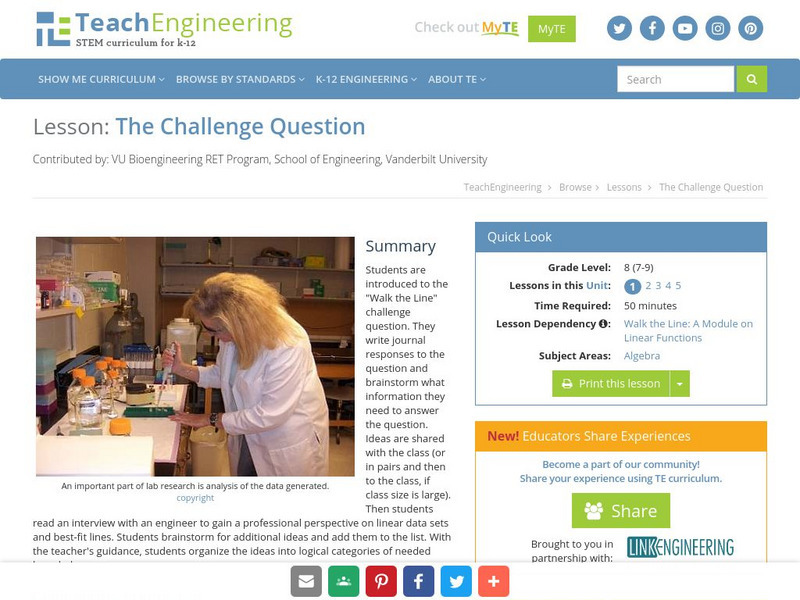
Teach Engineering: The Challenge Question: "Walk the Line"
Learners are introduced to the "Walk the Line" challenge question. They are asked to write journal responses to the question and brainstorm what information they need to answer the question. Ideas are shared with the class (or in pairs...
University Corporation for Atmospheric Research
Ucar: Project Sky Math
Teachers will be interested to explore the SkyMath module, and the 16 classroom activities at this site. In this program, students will collect and record real-time weather data to analyze. Data analysis, graphing, number relationship,...
Better Lesson
Better Lesson: Going for the Gold
Second graders read and create graphs based on Olympic data for 2014.
PBS
Pbs Mathline Lesson Plan: Struts'n Stuff [Pdf]
Incorporating concepts in algebra, number sense, patterning, data collection, and geometry, this lesson engages students in various hands-on activities to explore the relationship between regular polygons and the number of diagonals...
Science Education Resource Center at Carleton College
Serc: Determination of Boyle's Law Through Data Collection
Students develop an understanding of the mathematical relationship between pressure and volume of a gas. Students will practice data collection and graphing skills while also making the connection between force and pressure
Other
A River Runs Through It Learning Project
In this year long learning project integrating mathematics and science, students solve environmental problems using data collection and problem solving concepts. Designed for upper elementary gifted students. Interactive components and...
PBS
Pbs: Mathline Creature Feature Lesson Plan [Pdf]
An interdisciplinary math, science, and language arts lesson plan that engages students in an exploration of statistics. Through a study of various forest climates, students utilize data collection and analysis, classification, and...
PBS
Pbs Mathline: Button, Button Lesson Plan [Pdf]
An integrated math and language arts lesson focusing on statistics. Young scholars explore the concepts of estimation, data collection, data analysis, classification, graphing, and counting through the reading of the Button Box by...
Alabama Learning Exchange
Alex: Get on Your Mark, Get Set, Go!
In collaborative/cooperative groups, students will review basic vocabulary and concepts for data and statistics. Students will create, collect, display, and interpret data in the form of frequency tables, bar graphs and circle graphs.
Alabama Learning Exchange
Alex: The Need for Speed
After viewing an introductory illustrated podcast on speed, distance, time, and velocity, learners explore distance-time graphs using interactive websites. Working in cooperative learning groups, students will investigate the motion of...
Alabama Learning Exchange
Alex: "Bursting With Math"
Using "Starburst" jelly beans to sort, graph and add.
Other popular searches
- Graphing Skills Lesson Plans
- Basic Graphing Skills
- Organizing and Graphing Data
- Introducing Graphing Skills
- Graphing Skills Using M&ms
- Graphing Skills in Science
- Graphing Skills for Prek
- Graphing Skills With Fruits
- Graphing Skills in Chemistry
- Graphing Skills for Perk
- Graphing Skills Worksheet
- Reading Graphing Skills


