Earth Watch Institute
Entering Local Groundhog Data in an Excel Spreadsheet
Here is a cross-curricular ecology and technology lesson; your learners create spreadsheets depicting the location and number of groundhog dens in a local park. They research groundhogs and analyze data about where the groundhog...
Curated OER
Graphing Changes in Weather
Students graph current temperature and weather conditions for three days. In this weather lesson, students go to the Weather Channel's website and look up weather for their zip code then graph the conditions and record the current...
Curated OER
Are You Full of Hot Air?
Explore the concept of measuring and recording circumference. In this physical science and measurement lesson, young learners blow up balloons, measure the circumference, and record the data on an interactive graphing website.
Curated OER
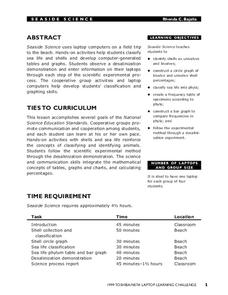
Seaside Science
Learners research sea life using laptop computers. In this sea life lesson, students participate in a field trip to the beach and enter observations into their laptop computers. Learners classify shells and sea life.
Curated OER
Using GLOBE Data to Study the Earth System (College Level)
Learners use the GLOBE Website to locate and study environmental data. They use the GLOBE Graphing Tool to display data. Students describe the role of solar energy in the annual fluctuations of soil moisture. They describe reservoirs and...
Curated OER
A Research Project and Article For the Natural Inquirer
Get your class to use the scientific process to solve a scientific problem. They utilize the Natural Inquirer magazine to identify a research question which they write an introduction to and collect data to answer. They use graphs,...
Curated OER
Is the Hudson River Too Salty to Drink?
Students explore reasons for varied salinity in bodies of water. In this geographical inquiry lesson plan, students use a variety of visual and written information including maps, data tables, and graphs, to form a hypothesis as to why...
Curated OER
The Disappearing Kelp Forest
Learners observe the effect "El Nino" left on kelp plants and sea urchins. They analyze the data collected by researchers, by graphing it on a TI calculator. Before graphing and analyzing the data, you may want to revisit the events of...
Curated OER
Creek Detectives WISE On-line Research Community
Students investigate ways people cause harm to the environment. In this environmental lesson, students explore a case study on the Internet. Students explore all of the online activities and collect data for a presentation.
Curated OER
MAISA and the REMC Association of Michigan
Learners complete online research to study geography's impact on weather. In this geography and weather lesson, students research weather in their city for ten days using an online website. Learners bookmark the site, enter data into a...
Curated OER
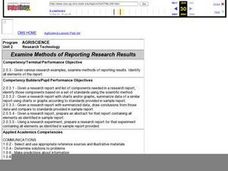
Examine Methods of Reporting Research Results
Learners analyze a research report and the list of components needed in a research report and then identify those components based on a set of standards using the scientific method. They collect data which can be used for a graphical...
Curated OER
Ladybugs
Third graders keep and report records of investigations and observations of ladybugs utilizing tools like journals, charts, graphs and computers. They discover and study the life cycle of ladybugs and complete a KWL chart about ladybugs.
Curated OER
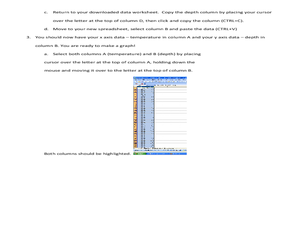
What's A Water Column Profile?
Students investigate water column data. In this earth science and seawater lesson, students determine how temperature, salinity, and density have an impact on sea water by viewing and analyzing data obtained from a number of websites....
Curated OER
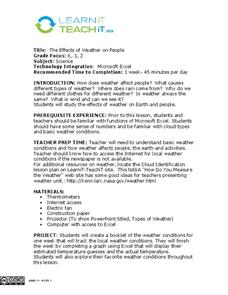
The Effects of Weather on People
Students discover the causes of different types of weather and it's effect on society. In this environmental lesson, students utilize the Internet to examine cloud types, normal weather conditions and the type of weather considered...
Curated OER
M & M Madness
Second graders graph M & M's by color. In this graphing lesson plan, 2nd graders first predict how many of each color they think are in a handful of M & M's. Then they graph the amounts of each color on a computer program....
Curated OER
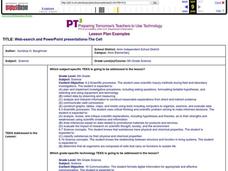
Web-search And PowerPoint Presentations-The Cell
Sixth graders create a PowerPoint presentation using information that they have compiled from their web search and rubric web sites, text and other applicable references. They work in pairs to complete these searches and projects.
Curated OER
Break the Code!
Seventh graders crack a code using binary numbers. In this technology lesson, 7th graders explain how binary codes can represent letters and numbers. They create their own code and exchange them with their classmates.
Curated OER
Baseball Stats
Students explore data sheets and statistics in baseball. They use baseball data available on the Internet to develop an understanding of the different ways in which data can be analyzed.
Curated OER
Using PING to determine factors of Internet delay
Students use the concepts of PING to examine Internet delay. They discuss why PING is used in the Computer Science industry. They practice interpreting data as well.
Curated OER
Magnetic Attraction
Second graders create a hypothesis on what objects will attract to magnets. In this magnets lesson plan, 2nd graders use a computer program to create a hypothesis as to what will attract or unattract magnets. For an extension, they test...
Curated OER
The Solar Cycle
Learners research the solar cycle. In this Science lesson, students use the internet to investigate the solar cycle. Learners produce a spreadsheet and graph from the information collected.
Curated OER
Migration of the Neo-Tropical Songbirds
Fifth graders plot the migration of birds using Google Earth. For this lesson on bird migration, 5th graders work in groups to plot the migration of a group of birds using Google Earth. Students present and discuss their findings and...
Curated OER
Internet Shopping Business Idea
Students create their own Internet business based on data they find concerning trends in Internet shopping. They discuss advantages and disadvantages to selling specific products and/or services over the Internet.


