Better Lesson
Better Lesson: Fast Food Freddie Surveys and Bar Graphs
Students continue to build their graphing skills. They experience a real world application of graphing by organizing survey results.
Fun Brain
Fun Brain: What's the Point? (Graphing Skills Game)
This graphing game challenges players to supply the coordinates for points shown on a series of graphs and also to plot pairs of coordinates on simple Cartesian planes.
Government of Alberta
Learn Alberta: Math Interactives: Exploring Data Display and Graphs
This multimedia Learn Alberta math resource focuses on graphing data. In the video portion, students will see how math is involved in the display of merchandise in stores. The accompanying interactive component provides an exploration...
TeachEngineering
Teach Engineering: Complex Networks and Graphs
Students learn about complex networks and how to represent them using graphs. They also learn that graph theory is a useful mathematical tool for studying complex networks in diverse applications of science and engineering, such as...
Texas Education Agency
Texas Gateway: Evaluating Data in Tables, Graphs and Charts
[Accessible by TX Educators. Free Registration/Login Required] In this lesson students look at examples of graphics, tables, charts, and graphs, and learn how to interpret their data. They will be able to use this skill to enhance their...
University of Canterbury
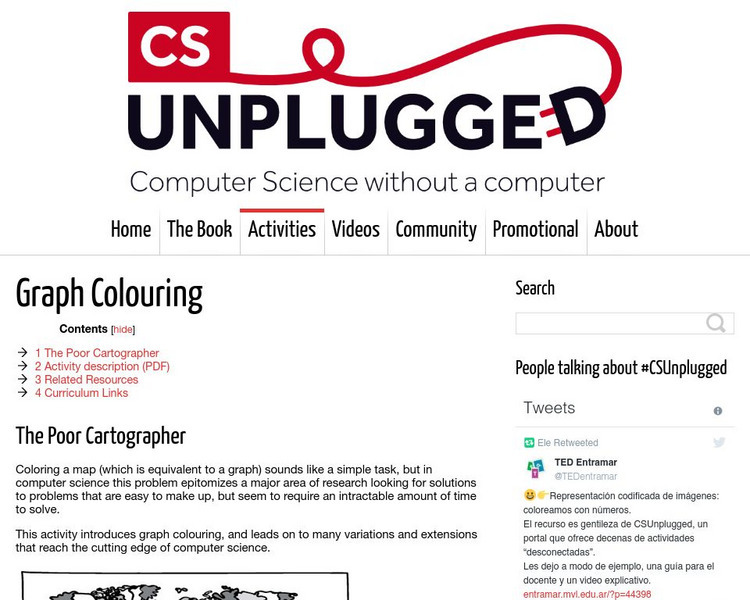
University of Canterbury: Cs Unplugged: Graph Colouring
Introduce graph coloring, and lead students on to many variations and extensions that reach the cutting edge of computer science.
Better Lesson
Better Lesson: Graphing Our Snack Mix: Review of Graphing
Second graders review how to make bar graphs, line plots, and pictographs by tallying the contents of snack mix and building graphs to show their data.
CK-12 Foundation
Ck 12: Statistics: Line Graphs Grade 7
[Free Registration/Login may be required to access all resource tools.] Make a line graph to display data over time.
CK-12 Foundation
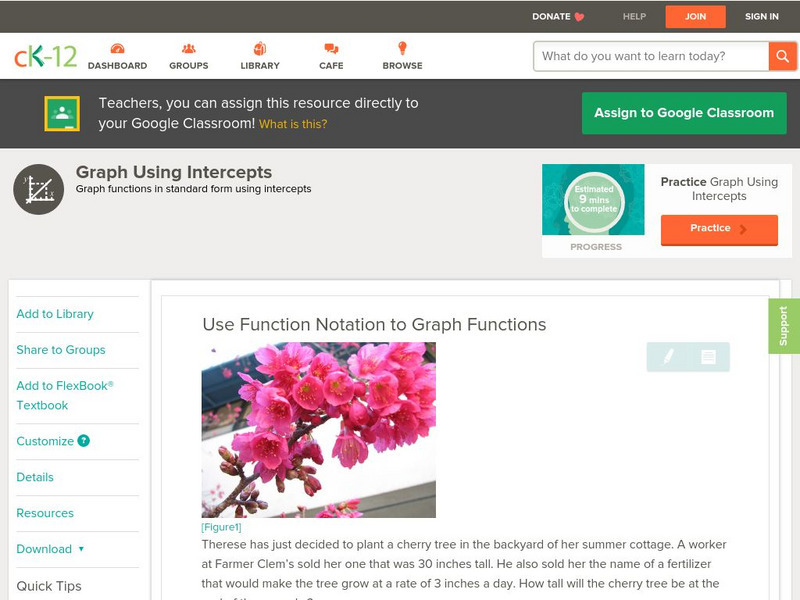
Ck 12: Algebra: Graphs of Linear Functions
[Free Registration/Login may be required to access all resource tools.] Students learn to use function notation to graph functions. Students examine guided notes, review guided practice, study vocabulary, watch instructional videos and...
CK-12 Foundation
Ck 12: Algebra: Graphs of Quadratic Functions in Intercept Form
[Free Registration/Login may be required to access all resource tools.] Find the x-intercepts and vertex of a quadratic function by writing it in intercept form and solve real-world problems. Students examine guided notes, review guided...
CK-12 Foundation
Ck 12: Statistics: Line Graphs to Display Data Over Time
[Free Registration/Login may be required to access all resource tools.] Create line graphs to display how data changes over time.
Can Teach
Can Teach Lesson Plan: Graphing Constellations
In this lesson plan, students practice their graphing skills by following directions to recreate constellations.
US Department of Education
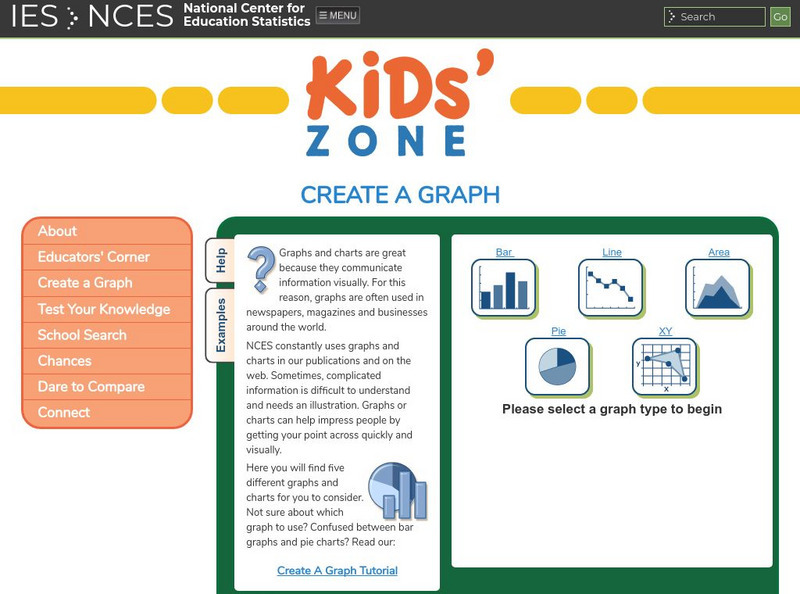
Nces Kids: Create an Xy Graph
This is where you can find a step by step explanation of how to create an XY graph. When you finish each step just click the next tab and you will find the next set of instructions.
Oswego City School District
Regents Exam Prep Center: Practice With Organizing and Interpreting Data
Several problems are presented to test your skills in creating and interpreting frequency tables, pie charts, box-and-whisker and stem-and-leaf plots.
University of Waterloo (Canada)
Wired Math: Organizing Data Grade 7 [Pdf]
A collection of worksheets that focus on data analysis and organizing data. Includes detailed examples, colorful visuals, and a link to a related game. Acrobat Reader required.
National Center for Ecological Analysis and Synthesis, University of California Santa Barbara
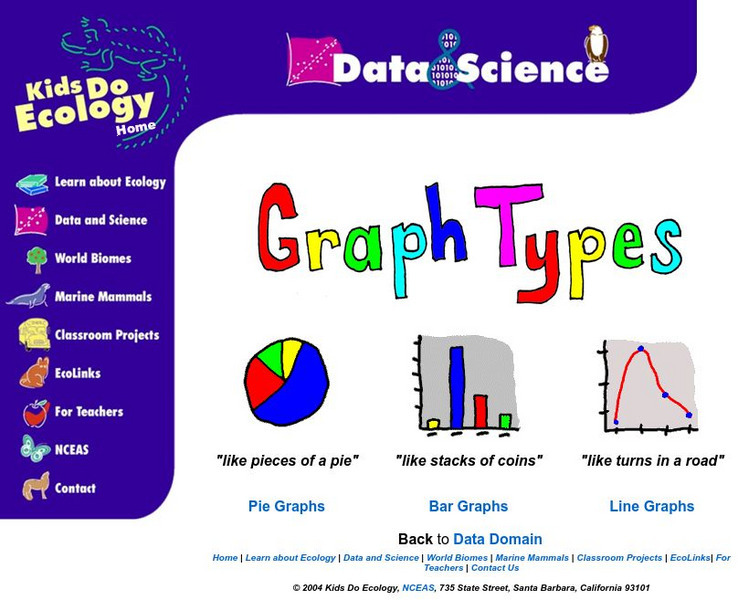
Nceas: Graph Types
At this site from NCEAS you can learn how to organize your data into pie graphs, bar graphs, and line graphs. Explanations and examples are given of each graph along with several questions that check comprehension.
E-learning for Kids
E Learning for Kids: Math: Group of Pyramids: Fractions and Graphs
On this interactive website, students practice various math skills using a real-life scenario at the pyramids. Those skills include showing percentages as fractions and decimals and interpreting data in a sector graph.
Mangahigh
Mangahigh: Data: Using Line Graphs
This site provides students practice with the concept of line graphs. Students can learn about the topic by completing an interactive tutorial. Students can then take a ten question timed test to practice the skill.
McGraw Hill
Glencoe: Online Study Tools: Quiz on Graphs of Trigonometric Functions
Students show comprehension of advanced mathematical concepts in Trigonometry. The online quiz assesses the scholars on the graphs of trigonometric functions.
McGraw Hill
Glencoe Mathematics Online: Study Tools: Graphing Linear Inequalities
This site gives a short interactive quiz which allows students to self-assess their understanding of the concept of graphing linear inequalities.
Lawrence Hall of Science
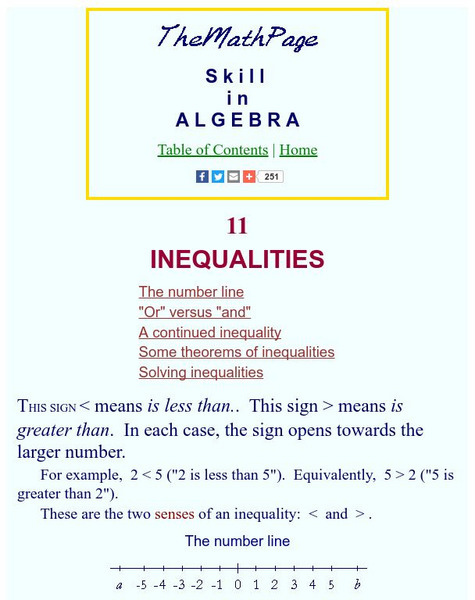
The Math Page: Skill in Algebra: Inequalities
Here is a site that clearly and thoroughly explains many topics related to inequalities, including solving and graphing simple and compound inequalities. There are example problems solved, problems for the student to attempt, and answers...
Other
Elmwood Park High School: Vertex Edge Graphs
In this Unit, you will use vertex-edge graphs and Euler Circuits to help find optimum paths. Included are two lessons that help you develop the understanding and skill needed to solve problems about optimum paths and conflicts.
Science Education Resource Center at Carleton College
Serc: Investigating Motion Graphing Speed
In this introduction to motion activity, students will get a personal understanding of speed and acceleration by experiencing it firsthand. Wheeled office chairs or other cart like devices are used to give one student a ride as a fellow...
Texas Instruments
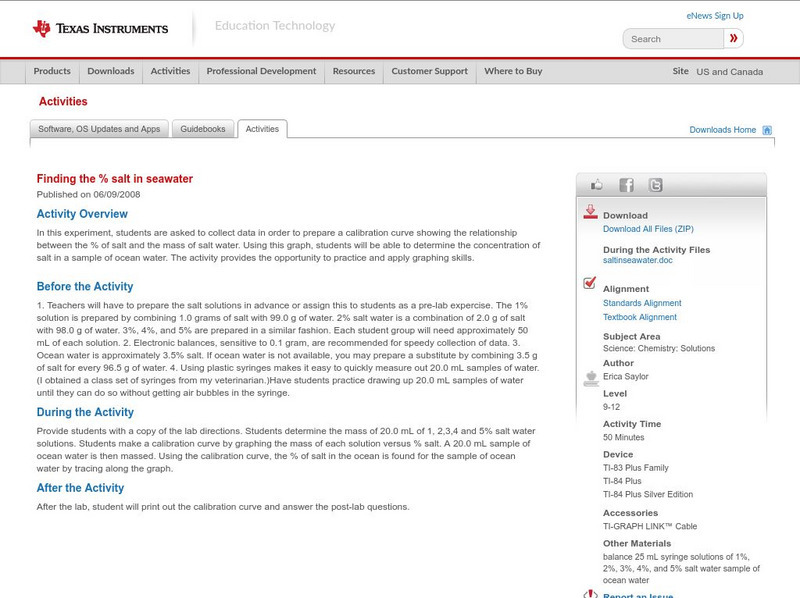
Texas Instruments: Finding the % Salt in Seawater
In this experiment, students are asked to collect data in order to prepare a calibration curve showing the relationship between the percentage of salt and the mass of salt water. Using this graph, students will be able to determine the...


