Curated OER
Playing with Money (From the Other Point of View)
Pupils explore exchange rates. They identify the units of currency of a number of countries. Students convert money amounts accurately. They graph currency fluctuations and interpret graphs.
Curated OER
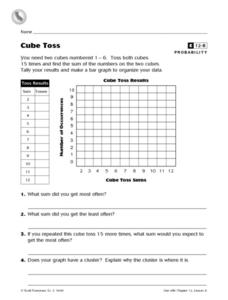
Cube Toss
In this probability and graphing learning exercise, learners solve 8 problems in which data from a cube toss is displayed on a table and graph. Students answer the questions about their results.
Curated OER
An Apple a Day
Students study apples and then paint apples whichever color is their favorite apple color. They help create a bulletin board for the classroom. They graph the different colors of apples found on the board.
Curated OER
Plotting Points
Eighth graders practice plotting points on a coordinate plane. As a class, they create and label the parts of a graph. Given ordered pairs, they plot the points, connect them to reveal a particular shape, and find the area of the shape.
Curated OER
Probability
Students complete various activities for probability. In this probability instructional activity, students use coins, cubes, peanut butter and jelly, playing cards, number cubes, darts, and a Gauss Curve to study probability. Students...
Curated OER
Weather Report Chart
Students complete a weather report chart after studying weather patterns for a period of time. In this weather report lesson, students measure temperature, precipitation, cloud cover, wind speed, and wind direction for a month. Students...
Curated OER
Algebra—Quadratic Equations and Functions
Learners use given information on wind speed with the quadratic formula to determine the pressure of the wind on a building. In this quadratic equations lesson, students compute the pressure of the wind from two data tables. They graph...
Curated OER
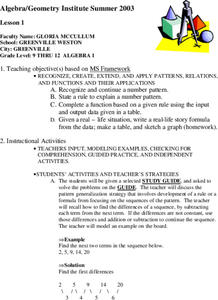
Patterns, Relations, and Functions
Students investigate the patterns of different data sets of numbers. They use critical thinking skills in order to find the missing numbers in any given set. This activity helps to develop the skill of number sense.
Curated OER
Data Analysis: bird habitats in rice farms
Fifth graders make a graph and write an essay to interpret the data of birds that take advantage of habitats near rice farms. In this data lesson plan, 5th graders calculate the information given to them and interpret it in an essay form.
Curated OER
Variation
In this variation activity, students interpret and organize data. They find the distance between points. Students use ratios to determine volume This six-page activity contains approximately 20 problems. Answers are provided on the...
Curated OER
IT IS ABOUT SUPPLY AND DEMAND.
Students learn that the price of an item is defined by its supply and demand. In this lesson students graph the relationship between demand and supply of various products, students also consider hidden costs.
Curated OER
Fun Creative Activities that Teach Math
Students have fun with math. In this math skills lesson, students collaborate to solve the problems presented in this interactive lesson. The problems pertain to geometry, measurement, probability, number sense, and algebra.
Curated OER
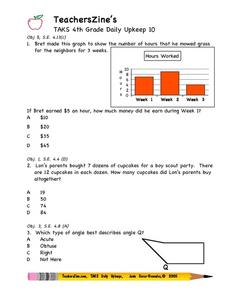
TAKS 4th Grade Daily Upkeep 10
In this math worksheet, 4th graders look for the answers to basic review problems that focus upon the skills of reading simple word problems, and applying the interpretation of data.
Curated OER
Cinco De Mayo
Students make a graph identifying the immigration of Mexicans to the US. In this algebra lesson, students practice graphing as they review different trends in immigration over the past 100 years. They interpret and analyze their graphs.
Curated OER
Graphing Linear Equations
Ninth graders develop an understanding of and the applications for linear equations and their graphical displays. They participate in a cooperative learning activity of matching a graphic display with an equation.
Curated OER
6.5 Skill Builder: Trigonometric Identities
In this trigonometric identities worksheet, students solve 16 multi-part short answer problems. Students use the quotient identity and Pythagorean identity to simplify trigonometric expressions. Students factor trigonometric expressions.
Curated OER
The Study of Urban and Suburban Environments within the Mystic River Watershed
High school students examine their own water-based environments, within the Mystic Watershed. As the learners engage in inquiry-based, hands-on projects, critical thinking skills and problem-solving, the project will lead them to cross...
Curated OER
Range, Mean, Median, Mode
Students research the impact of craters. In this range, mean, median and mode lesson, students complete an experiment with a marble to simulate the effects of a crater. Students collect and analyze data finding the range, mean, median...
Curated OER
Learning About Ratios: A Sandwich Study
Students gain a concrete introduction to the concept of ratios. They demonstrate the ability to create ratios using peanut butter and jelly. They, in groups, construct 6 different sandwiches using different amounts of each food.
Curated OER
Graphing
Fifth graders create graphs based on climate in South Carolina. They read and interpret information in a chart and construct a graphy from the information in the chart. They create a spreadsheet using Excel and publish 2 graphs.
Curated OER
Graphing Current Drug Data
Students increase understanding of the drug issue and further develop skill in graphing.
Curated OER
Graph Your Foot!
Students measure their own foot and place the outline on a graph. They make connections between the size of their foot and the bar graph that represents it.
Curated OER
Monster Graph Activity
Seventh graders engage in a lesson plan which take the fear out of graphing. They create and draw conclusions from data found in a Monster graph.
Other popular searches
- Graphing Skills Lesson Plans
- Basic Graphing Skills
- Organizing and Graphing Data
- Introducing Graphing Skills
- Graphing Skills Using M&ms
- Graphing Skills in Science
- Graphing Skills for Prek
- Graphing Skills With Fruits
- Graphing Skills in Chemistry
- Graphing Skills for Perk
- Graphing Skills Worksheet
- Reading Graphing Skills


