Curated OER
Immigration and Citizenship
Learners make graphs showing Canada's immigration patterns over time. Then students play the role of an immigrant seeking citizenship and perform a mock citizenship ceremony.
Curated OER
Little Boy Blue
First graders read nursery rhymes and celebrate Mother Goose. For this drawing conclusions and predicting lesson, 1st graders create new ending for the nursery rhymes. Students gather data and make a graph showing their favorite rhyme.
Curated OER
The Old Lady and Probability
First graders explore the concept of probability using a familiar nursery rhyme. Over the course of several lessons, they determine the probabilty of events happening in the nursery rhyme, "There Was An Old Lady." Students graph and...
Curated OER
Rational Numbers
Young scholars investigate rational numbers in this algebra lesson. They graph systems of equations and use technology to find the point of intersection. They need a TI for this assignment.
Alabama Learning Exchange
Keep It Movin'!
Learners conduct an experiment to study friction. They complete a KWL chart on friction and conduct an activity about the amount of friction on a moving object. To conclude, pupils create a table or graph of the data collected and they...
Curated OER
Mean, Median, Mode and Range
Fourth graders investigate when to find the mean, median, mode and range. In this statistical concepts lesson, 4th graders collect data, make observations and graph the data. Students verify their work on the computer.
Curated OER
Pumped Up Gas Prices
Students calculate gas prices. In this transportation lesson, students tally the mileage and gas costs of their car for one months. They figure out how much was spent on gas and create a graph showing average gas prices over time.
Curated OER
Math Snack
Students practice math skills as they sort treats for snack. They prepare a table for snack. They count snack items. They complete a graph using the counted items.
Curated OER
How Long? How Wide?
Second graders distinguish between and use nonstandard and standard units of measurement, use appropriate tools and techniques to measure length and width, and record and interpret data using graphs.
Curated OER
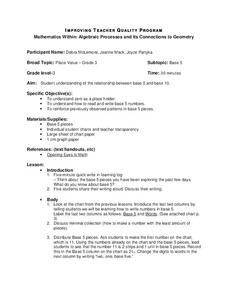
Place Value
Third graders study the relationship between base 5 and base 10. They determine zero is a place holder and how to read and write base 5 numbers. They reinforce previously observed patterns in base 5 pieces. They choose another base and...
Curated OER
Traveling Through the Solar System
Learners use calculator and non-calculator methods for analyzing data. They apply data collection and analysis in a study of mass and weight. Students enhance and apply the concept of line of best fit. They master graphing in a plane,...
Curated OER
Dealing with Data in Elementary School
Students follow the scientific method in collecting data. In this following the scientific method in collecting data instructional activity, students develop a question they would like answered such as how many aluminum cans are...
Curated OER
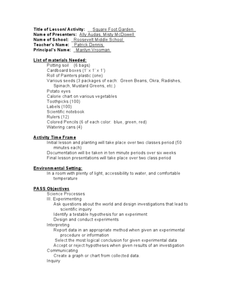
Square Foot Garden
Students plant a garden and keep track of it. For this geometrical garden lesson, students collect data from their garden twice a week. They graph their finding and figure out how many square feet of growing space each person needs for...
Curated OER
Simply the Best
Students determine whom they consider "the best" performer in a variety of entertainment industries and discuss how to accurately measure greatness. They create bar graphs comparing statistics of the 1975 Cincinnati Reds and the 1998 New...
Curated OER
You Bet!
Students explore the mathematical probabilities involved in gambling and how these factors affect people's behavior. They work in pairs and conduct and experiment pertaining to blackjack. The class creates a graph showing the trends found.
Mathematics TEKS Toolkit
Grade 6: Exploring c/d = pi
Introduce your math class to the perimeter of a circle. Teach them that pi describes the relationship between the circumference and the diameter. As a hands-on investigation, pairs or small groups use string to compare these two values...
Curated OER
Lego Robotics: Measuring Speed
Students build and program a LEGO robotic car as well as measure and graph its speed. They acquire familiarity with principles of construction, motion, design and problem solving. They compare a robot's speed over two different surfaces...
Curated OER
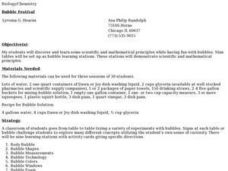
Bubble Festival
Students practice scientific inquiry while learning about bubbles. In this lesson plan about bubbles, students explore characteristics of bubbles. Students move through nine different "bubble" stations following directions and completing...
Curated OER
What Would Make Our School More "Green"?
Students survey their school to get ideas for how to make the school more environmentally friendly. In this environmental lesson, students collect data from other students and teachers. They use the data to create graphs and present a...
Curated OER
Applied Maxim Mininmum Problems
Students define the maximum and minimum of an equation. In this calculus lesson, students analyze point on a graph and determine when a graph is approaching a maximum or minimum. They take a Quiz after working some review problems.
Curated OER
Mean Meadian and Mode
Students apply central tendencies to given data. In this statistics lesson, students calculate the mean, median, and mode as it relates to their data. They collect data and graph it while identifying the way the numbers are ordered.
Curated OER
Lines in the Plane
Young scholars differentiate between parallel and perpendicular lines. In this algebra lesson, students graph linear equations using the slope intercept form. They classify lines based on their slopes.
Curated OER
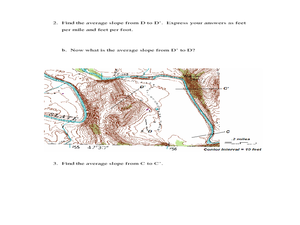
Slope and Topographic Maps
Students investigate slopes as they study topographic maps. For this algebra lesson, students discuss and apply the concept of slopes to graphing and analyzing data.
Curated OER
So Fast! So Slow!
Fifth graders give examples of objects that move slow and fast. In this physics lesson, 5th graders rank animals according to how quickly they move. They create a bar graph of organisms versus rates of speed.
Other popular searches
- Graphing Skills Lesson Plans
- Basic Graphing Skills
- Organizing and Graphing Data
- Introducing Graphing Skills
- Graphing Skills Using M&ms
- Graphing Skills in Science
- Graphing Skills for Prek
- Graphing Skills With Fruits
- Graphing Skills in Chemistry
- Graphing Skills for Perk
- Graphing Skills Worksheet
- Reading Graphing Skills


