Curated OER
Math Journal: Functions and Coordinate Geometry
Fifth graders examine the many uses of coordinate grids. In this graphing lesson, 5th graders write data driven equations, discuss the x and y-axis, and determine if using 2 or 3 ordered pairs is better. Students complete several...
Curated OER
Transforming Snoopy Using Coordinates
Learners graph coordinate points to create a picture of Snoopy. For this coordinate point lesson, students read a book and learn about Rene Descartes' invention, the coordinate grid. Learners graph a surprise picture on Geometer's...
Curated OER
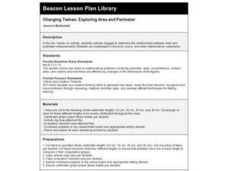
Changing Twines: Exploring Area and Perimeter
Third graders review formulas for area and perimeter in quadrilaterals. They arrange pre-cut twine on a centimeter graph paper to create non-congruent quadrilaterals. They calculate the perimeter and area of each form.
Curated OER
A Closer Look: Unemployment
Students view a video clip about unemployment. They research data and create a scatter plot graph. They discover the importance of graphs and what they can tell us. They create their own publication on unemployment.
Curated OER
Income Levels & Social Class: Is It All About Cash?
Learners graph data and interpret that data after reading information about lifestyles and income levels. They calculate percentages, set up spreadsheets and calculate columnar data.
Curated OER
Why Would I Owe My Soul to the Company Store?
Sixth graders listen to "Sixteen Tons" by Tennessee Ernie Ford and discuss what it means to owe one's soul to a store. In this mathematics lesson, 6th graders determine what a miner's income was minus his expenses graphing findings in a...
Curated OER
Ordered Pairs on a Coordinate Plane
Seventh graders identify the quadrants and axis of a coordinate plane. For this algebra lesson, 7th graders discover the correct way to graph using the coordinate plane. They discuss the relationship between x and y values, domain and...
Curated OER
Coin Count & Classification
Students make a prediction about how 100 pennies sort by decade or year and then test their predictions. They organize their data using a graph that is imbedded in this lesson.
Curated OER
New Kids in The Hall
Students assess the role of statistics in determining those athletes chosen to be inducted into the Baseball Hall of Fame. They work in small groups to calculate, chart, and graph various statistics for different Hall of Fame members.
Curated OER
Baseball Statistics
Young scholars read "Casey at the Bat" and then use individual player statistics (found through internet research)to determine if their players could be considered baseball "heroes". They must justify their choices for "hero" by creating...
Curated OER
Math: Skyscraper Comparison
Students examine skyscrapers by conducting Internet research and by creating and interpreting graphs. After reading the book, "Skyscraper," they discuss reasons why the structures are built. Once they have researched the tallest...
Curated OER
Exploration Sequence of Bounces
New skills are developed as high schoolers use graphing calculators and ranger technology to capture and graph the sequence of bounces a ball makes when dropped. After recording the height of four or more bounces, they use the collected...
Texas Instruments
Exploring Tangents
Explore the concept of tangent lines. In this tangent line lesson, learners graph a circle and two lines on their graphing calculator using Cabri Jr. Students construct the lines so that they both intersect at a given point and are both...
Curated OER
A Class Census
Students recognize that data represents specific pieces of information about real-world activities, such as the census. For this census lesson, students take a class and school-wide census and construct tally charts and bar graphs to...
Curated OER
Which Method Will You Choose? Finding Solutions to Systems of Equations.
Ninth graders investigate systems of linear equations. In this Algebra I lesson, 9th graders determine which method is the best for solving a systems: graphing, substitution, or elimination. Students choose a method and create a...
Curated OER
Slopes and Linear Equations
Learners find the slopes of linear functions. In this graphing lesson, students analyze linear equations and calculate the slope of the line. They graph a line given the slope and y-intercept.
Curated OER
Global Statistics
Students determine statistics based on data. In this statistics lesson, students use data and record in charts. Students create graphs based on the statistics found.
Curated OER
The Solar Cycle
Learners research the solar cycle. In this Science lesson, students use the internet to investigate the solar cycle. Learners produce a spreadsheet and graph from the information collected.
Curated OER
Geometric Fractals and the Chaos Game
Young scholars define fractals and patterns. They explore how a seemingly random process can result in a pattern. Students practice probability and fractions skills by playing the chaos game online.
Curated OER
Polluting the Environment
Fourth graders construct mini-ecosystem, pollute the ecosystem, observe, collect, and record data on the effects of these pollutants on their ecosystem, organize data on spreadsheets, create graphs, and design presentations to share with...
Curated OER
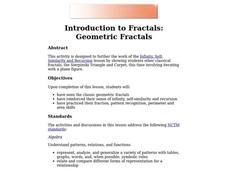
Introduction to Fractals: Geometric Fractals
Middle schoolers study and observe the patterns made by the areas of the Sierpinski Triangle. Students use the computer to draw two or three iterations to discover the number patterns. Middle schoolers complete worksheets based on...
Curated OER
CSI Rhino
Students study the rhinoceros and how the species has survived for so long. In this rhino lesson students create graphs and research what is being done to protect the rhino.
Curated OER
Rock On
Students analyze trends in the Grammy Award winners this year and create graphs displaying their findings.
Curated OER
The Price of Relief
Students calculate and graph the costs of essential items needed in Kosovar refugee camps on an individual, family, and camp basis. Additionally, students explore how relief organizations and businesses participate in relief efforts.
Other popular searches
- Graphing Skills Lesson Plans
- Basic Graphing Skills
- Organizing and Graphing Data
- Introducing Graphing Skills
- Graphing Skills Using M&ms
- Graphing Skills in Science
- Graphing Skills for Prek
- Graphing Skills With Fruits
- Graphing Skills in Chemistry
- Graphing Skills for Perk
- Graphing Skills Worksheet
- Reading Graphing Skills


