Curated OER
Exploring Renewable Energy Through Graphs and Statistics
Ninth graders identify different sources of renewable and nonrenewable energy. In this math lesson, learners calculate their own carbon footprint based on the carbon dioxide they create daily. They use statistics to analyze data on power...
University of Colorado
Spacecraft Speed
Space shuttles traveled around Earth at a speed of 17,500 miles per hour, way faster than trains, planes, or automobiles travel! In the 13th installment of 22, groups graph different speeds to show how quickly spacecraft move through...
Science 4 Inquiry
The Ups and Downs of Populations
Life has its ups and downs ... especially if you're an animal! Biology scholars engage in a population study through an inquiry-based lesson. Pupils work together to explore the factors that affect deer populations, then examine the...
NASA
Earth, Can You Hear Me Now?
How long did you say? Class groups plot the distances between Earth and Mars and determine the trigonometric function that models the data. Using a calculator, they graph the function to determine when the distance and communication...
Curated OER
Evolution Study Guide
Thirty short-answer questions comprise this detailed review of evolution theory. Many of the questions ask scholars to define vocabulary. Because short answers are required, this worksheet will take some time to complete. You could give...
Rainforest Alliance
Forests of Guatemala
With 90 percent of its land area covered in forests, Suriname, a country in South America, contains the largest percentage of forests throughout the world. Here is an activity that brings classmates together to learn about the...
NASA
Discovering the Milky Way
What do you call a tiny collection of galaxies? A puny-verse! Young scholars graph data gathered by scientists studying Cepheids. They attempt to identify a relationship between the variables through standard and logarithmical graphing....
Polar Trec
Global Snow Cover Changes
Snow is actually translucent, reflecting light off its surface which creates its white appearance. Pairs or individuals access the given website and answer questions about snow cover. They analyze graphs and charts, examine data, and...
University of Colorado
Graphing the Rainbow
Here's a colorful resource about spectra. An intriguing lesson teaches pupils about diffraction grating and about absorption and emission spectra. They see how to represent spectra using line plots and try out this skill in a matching...
Curated OER
Graphing in an Experimental Context
Seventh graders discuss the importance of being able to represent scientific data in the form of graphs. They comprehend the differences between a bar graph and a line graph. Students identify the type of data with which each graph...
Intel
What Does This Graph Tell You?
Students choose natural phenomena to research. They design and conduct experiments or simulations. Students predict, gather, and analyze data. They graph the results using a spreadsheet software.
Curated OER
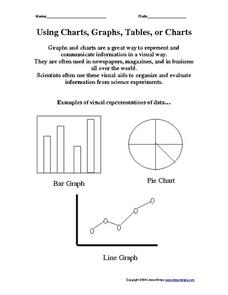
Using Charts, Graphs, Tables, or Charts
For this charts, graphs and tables worksheet, students view 3 different types of visual representations of data, make a list of 20 items and decide how the items can best be put together in groups to make a graph, chart or table....
Curated OER
Sorting and Graphing Animals
Students inquire about animals using SIRS Discoverer or eLibrary Elementary. In this organizing data lesson, students sort pictures of animals in various ways and develop graphs. Students locate a mammal, reptile, fish, insect or bird...
Curated OER
Discovering Magnets and Graphs
Sixth graders investigate averages and statistics by discovering magnet strengths. In this magnet experiment lesson, 6th graders utilize different magnets and attempt to attract different materials to them. Students record the...
Curated OER
Interpreting Data from Birdfeeders
What kinds of birds live in your area? Read a book about birds to your learners and explore their feeding patterns. Charts and graphs are provided in this three page packet, but consider assigning the basic questions if using with young...
Curated OER
Curious Clouds
Second graders explore clouds. They read The Cloud Book by Tomie dePola. Students sort the cloud pictures into three categories. Students create a graph using the cloud pictures. They use Excel to create a bar graph.
Curated OER
Tides at the Battery, NY
Skill in using Excel and increasing proficiency in manipulating data are challenged with this data analysis work. A web link supplies data and step-by-step instructions help learners create a graph. There are many extension activities...
Curated OER
The Hudson's Ups and Downs
Even rivers have tides. Older elementary schoolers will discuss the Hudson River and how weather, water craft, and the ocean cause tidal fluctuation. They will examine a series of line graphs that depict tidal fluctuation, then analyze...
Curated OER
Invasives and Marsh Birds
Pupils are taught that invasive plant removal can have a variety of impacts. They are shown this by using graphs. Students view maps of vegetation change on Iona Island. They discuss implications of changes on marsh birds using data and...
Curated OER
Surviving AIDS
Enhance your middle and high schoolers' research skills with this lesson. After viewing a video clip about HIV and AIDS, high schoolers identify the facts and issues surrounding the disease. They work together to create a newspaper...
NASA
Weightless Wonder
A video of the weightless wonder provides a setting for the math to follow. Groups analyze the graph of a quadratic function that models the path of the C-9 as it gives astronauts the experience of weightlessness. Using a graphing...
CPO Science
Science Worksheets
If you need an array of worksheets to augment your science lessons, peruse a collection of assignments that is sure to fit your needs. With topics such as metric conversion, the scientific method, textbook features, research skills,...
NASA
Space Shuttle Ascent: Mass vs. Time
Set the stage for groups of rocket scientists to explore the change in mass of the space shuttle during ascent. Teams work together to graph actual launch data in order to determine the rate of propellent burn.
University of Colorado
The Moons of Jupiter
Middle schoolers analyze given data on density and diameter of objects in space by graphing the data and then discussing their findings. This ninth installment of a 22-part series emphasizes the Galilean moons as compared to other objects.
Other popular searches
- Graphing Skills Lesson Plans
- Basic Graphing Skills
- Organizing and Graphing Data
- Introducing Graphing Skills
- Graphing Skills Using M&ms
- Graphing Skills in Science
- Graphing Skills for Prek
- Graphing Skills With Fruits
- Graphing Skills in Chemistry
- Graphing Skills for Perk
- Graphing Skills Worksheet
- Reading Graphing Skills


