Intel
Energy Innovations
Collaborative groups examine the importance of energy resources on quality of life by researching different energy sources and alternative energy sources through data analysis. They make a comparison of different countries and cultures,...
Intel
What Does This Graph Tell You?
What can math say about natural phenomena? The fifth STEM lesson in this project-based learning series asks collaborative groups to choose a phenomenon of interest and design an experiment to simulate the phenomenon. After collecting...
Radford University
Sleep and Teen Obesity: Is there a Correlation?
Does the number of calories you eat affect the total time you sleep? Young mathematicians tackle this question by collecting their own data and making comparisons between others in the class through building scatter plots and regression...
Texas Education Agency
Texas Gateway: Scientific Investigation and Reasoning Data Organization
Using interactive exercises, students will review how to construct tables and graphs in order to organize data.
Sophia Learning
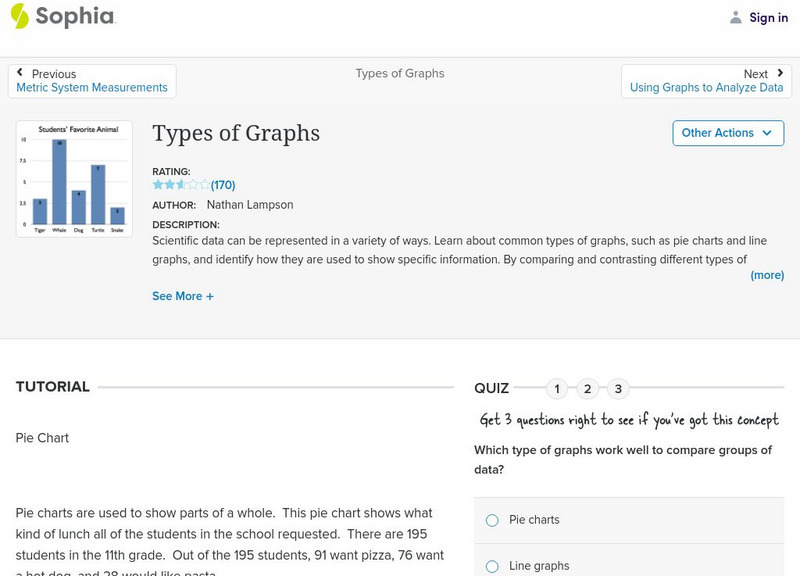
Sophia: Types of Graphs
This presentation allows the learner to visualize the different types of graphs used to display data in scientific investigations.
CK-12 Foundation
Ck 12: Physical Science: Scientific Graphing
[Free Registration/Login may be required to access all resource tools.] Usefulness and types of graphs.
Exploratorium
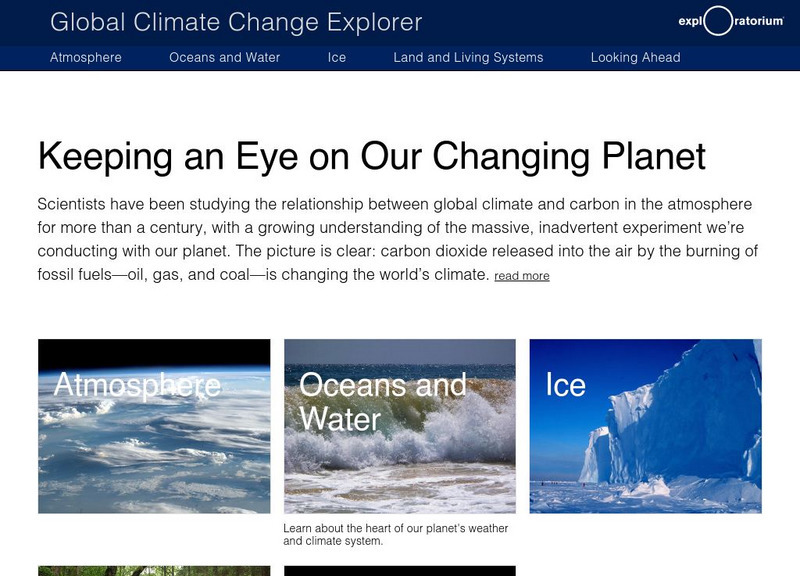
Exploratorium: Global Climate Change: Research Explorer
Explore scientific data relating to the atmosphere, oceans, areas covered by ice, and living organisms in all these domains. Interpret past and present climate data to predict future climate change and its possible effects.
TeachEngineering
Teach Engineering: Walk the Line: A Module on Linear Functions
This module leads students through the process of graphing data and finding a line of best fit while exploring the characteristics of linear equations in algebraic and graphic formats. Then, these topics are connected to real-world...


