West Contra Costa Unified School District
Graphing Piecewise Functions
Step up to learn about step functions. The lesson, designed for high schoolers, first covers piecewise functions and how to draw their graphs. It then introduces step functions, including the greatest integer (floor) and...
Curated OER
Linear Piecewise Functions
Students explore the concept of piecewise functions. In this piecewise functions lesson, students graph piecewise functions by hand and find the domain and range. Students make tables of values given a piecewise function. Students write...
EngageNY
Four Interesting Transformations of Functions (Part 4)
What do you get when you cross piecewise functions with transformations? An engaging lesson! The conclusion of a four-part series on the transformations of functions asks class members to apply transformations to piecewise...
EngageNY
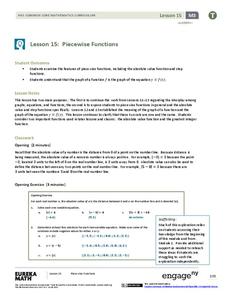
Piecewise Functions
Show your class members that if they can graph a linear function, they can graph an absolute value function. Groups create an absolute value graph using a table, then entertain the idea of an absolute value function defined as two...
EngageNY
Graphs of Piecewise Linear Functions
Everybody loves video day! Grab your class's attention with this well-designed and engaging resource about graphing. The video introduces a scenario that will be graphed with a piecewise function, then makes a connection to domain...
Curated OER
Types of Functions and Composition of Functions
Algebra II classes solve problems relating to piecewise functions, step functions, and decomposition/composition of functions. They utilize links to work with real world examples. Mr. Pleacher has added humor to the instructional...
EngageNY
Increasing and Decreasing Functions 1
Model situations with graphs. In the fourth installment of a 16-part module, scholars learn to qualitatively analyze graphs of piecewise linear functions in context. They learn to sketch graphs for different situations.
EngageNY
Analyzing a Graph
Collaborative groups utilize their knowledge of parent functions and transformations to determine the equations associated with graphs. The graph is then related to the scenario it represents.
EngageNY
Piecewise and Step Functions in Context
Looking for an application for step functions? This activity uses real data to examine piecewise step functions. Groups create a list of data from varying scenarios and create a model to use to make recommendations to increase...
EngageNY
Two Graphing Stories
Can you graph your story? Keep your classes interested by challenging them to graph a scenario and interpret the meaning of an intersection. Be sure they paty attention to the detail of a graph, including intercepts, slope,...
Mathematics Assessment Project
Representing Functions of Everyday Situations
Functions help make the world make more sense. Individuals model real-world situations with functions. They match a variety of contexts to different function types to finish a helpful resource.
Curated OER
Slope, Vectors, and Wind Pressure
A hands-on lesson using the TI-CBR Motion Detector to provide information to graph and analyze. The class uses this information to calculate the slope of motion graphs and differentiate scalar and vector quantities. There is a real-world...
Curated OER
Linear Graph
Students solve linear equations and graph the different functions. In this algebra lesson, students graph piecewise functions using the slope and y-intercept and the given restrictions on the domain of the line. They discuss rate of...
Curated OER
Piecewise Linear Integral
Young mathematicians solve and graph piecewise functions in this calculus activity. They integrate linear functions containing restrictions and graph their answers using the TI.
EngageNY
Increasing and Decreasing Functions 2
Explore linear and nonlinear models to help your class build their function skills. In a continuation of the previous lesson, learners continue to analyze and sketch functions that model real-world situations. They progress from linear...
EngageNY
Modeling a Context from a Graph
Collaborative pairs develop functions that model a graph from a context using the modeling cycle. They then analyze their function models in order to answer questions about the scenario.
Curated OER
The Function Elevator
Pupils solve and graph functions. In this precalculus lesson, students use piecewise function to relate real life scenarios. They analyze the graphs and identify the vertex and intercepts.
Curated OER
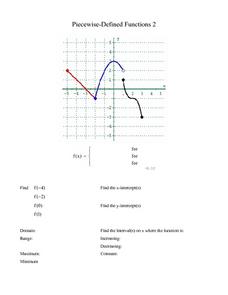
Piecewise-Defined Functions 2
In this Piecewise-Defined function worksheet, 10th graders identify the function for a given graph. Additionally, they find the y-intercept, y-intercept, domain, range and interval of each function. Students solve this information for...
Curated OER
Piecewise-Defined Functions 1
In this piecewise-defined function, learners explore the graph of given functions and match it to the proper equation. They identify the x and y-intercepts, domain, range, and interval of each function. There are approximately ten...
Texas Instruments
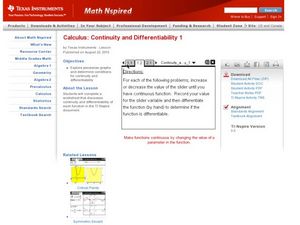
Continuity and Differentiability 1
Pupils examine graphs for continuity and differentiability in this calculus lesson. They observe piecewise functions to see where continuity and differentiability come into play. Learners finish by graphing their equation on the TI...
Curated OER
Match Me Plus
Have your class investigate Piecewise functions by matching a position versus time graph to the function that describe the walk.
Curated OER
Functions and the Vertical Line Test
Students examine functions and function notation. They use computer activities to discover how to graph functions, and conduct a vertical line test. Students describe spatial relationships using coordinate geometry.
Curated OER
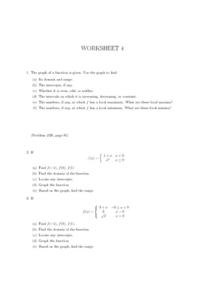
Worksheet 4, Functions
Eighth and ninth graders graph a given function and identify the domain, range and intercepts. Theytell the intervals that the function is increasing, decreasing, or constant. Pupils identify the minimum and maximum of the graph, and...
Curated OER
Piecewise Modeling with Multiple Functions: Federal Debt
Students analyze data on debt and write an equation. In this statistics lesson, students are given data from different time periods, and are asked to graph and analyze the data. They work in groups, and are assigned different parts of...


