Curated OER
TI Calculator
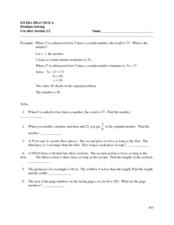
In this algebra worksheet, 11th graders troubleshoot the TI-83/84 graphing calculator. They review the proper process to use when entering equations and fractions into the calculator. There are 4 example problems worked out.
Texas Instruments
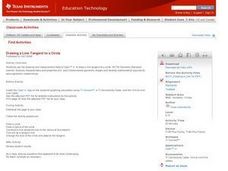
Drawing a Line Tangent to a Circle
Explore lines tangent to a circle. In this math lesson plan, students manipulate circles and lines on a TI calculator. They draw a circle and analyze perpendicular lines intersecting the circle in only one place. This activity...
Curated OER
Domian and Range of Graphs
High schoolers determine the domain and range of various graphs using a graphing calculator. Given a set of graphs to analyze, learners calculate the range and domain of the graphs by plotting the graphs on their calculators. Downloads...
Curated OER
Graphing Quadratic Functions
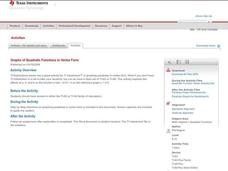
Pupils explore quadratic functions in this algebra lesson. They investigate transformation of quadratic functions using the TI calculator. They use the vertex form for this lesson.
Curated OER
Function Graphing--ID: 8252
Those graphing calculators can be tricky; good thing Texas Instruments has devised a lesson on how to use their TI-Nspire calculator to graph functions. Kids investigate functional notation as they graph ordered pairs in the form (a,...
Curated OER
Investigating Linear Equations Using Graphing Calculator
Students investigate linear equations using the Ti-Calculator. For this algebra lesson, students graph lines and identify the different quadrants on a coordinate plane. They identify ordered pairs used to plot lines.
Curated OER
TI Math, Games
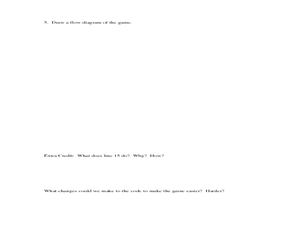
Students solve problems using technology. In this algebra lesson, students apply flow diagrams and computer codes to solve problems. They use the TI to view the graphs.
Curated OER
Sign of the Derivative
Learn how to investigate the change in a graph by dragging the cursor to observe the change in the function. They use the TI calculator to graph their parabola.
Curated OER
Exponential vs. Power
Pupils differentiate between exponential and power functions. They identify the base, exponent and properties of exponential functions. They also graph the functions using the TI calculator.
Curated OER
The Disappearing Kelp Forest
Learners observe the effect "El Nino" left on kelp plants and sea urchins. They analyze the data collected by researchers, by graphing it on a TI calculator. Before graphing and analyzing the data, you may want to revisit the events of...
Texas Instruments
Graphs of Rational Functions
Take your kids on a tour of graphing rational functions. Using this TI lesson, high schoolers identify the end behavior of their functions. They find the domain and range, describe end behavior, and look at asymptotes and restrictions of...
Curated OER
Graphing Exponentials
Bring your Algebra class to the computer lab! Using materials created by Texas Instruments, they explore exponentiasl and graphs. Be sure to download the correct materials (on the right side of the webpage) before having them walk...
Curated OER
Algebra 1: Slope as Rate
Students solve problems with slopes. In this algebra lesson, students identify the slope of a line and relate it to the rate of change. They graph their lines on the TI and observe changes in the lines.
Curated OER
Walking on Air
Students collect and analyze data with a graph. In this statistics lesson, students use central tendencies to find the meaning of their data. They display the data on a Ti calculator.
Curated OER
Exploring Quadratic Data : Transformation Graphing
High schoolers analyze the vertex form of a parabola and find an approximate fit of a model. They explain the quadratic parabola function and its properties by developing quadratic models. They use translation and dilation to change the...
Utah Education Network (UEN)
Linear Relationships: Tables, Equations, and Graphs
Pupils explore the concept of linear relationships. They discuss real-world examples of independent and dependent relationships. In addition, they use tables, graphs, and equations to represent linear relationships. They also use ordered...
Curated OER
Polar Graphs
Students graph polar graphs. In this calculus instructional activity, students convert between polar and rectangular coordinates. They graph their solution on the TI calculator and make observations.
Curated OER
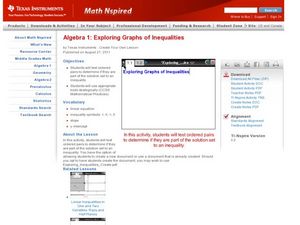
Exploring Graphs of Inequalities
Learn how to solve inequalities and graph their answers. High schoolers use addition, subtraction, multiplication and division to solve problems. They analyze their graph using the TI calculator.
Curated OER
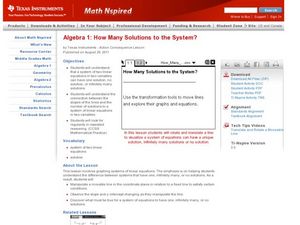
How Many Solutions to the System?
Solve systems of equation using graphing! In this algebra instructional activity, students use the TI to graph two lines and identify the number of solutions. They perform interactive graphing on the navigator.
Curated OER
Dependence of Light Intensity on Distance
Hopefully you have a sensor interface for your physics class to use with graphing calculators when collecting data with a light sensor. If so, read on. Use this resource for learners to predict and then test whether or not the intensity...
Curated OER
Transformations of Functions 2
Solving problems on the TI graphing calculator can be quite easy. Students observe the properties of transformation of functions and create a formula for the transformation.
Curated OER
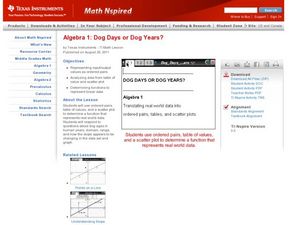
Dog Days or Dog Years?
In need of some algebraic fun with real world implications?Learners use ordered pairs, a table of values and a scatter plot to evaluate the validity of several real world data sets. The class focuses on dog ages in human...
Curated OER
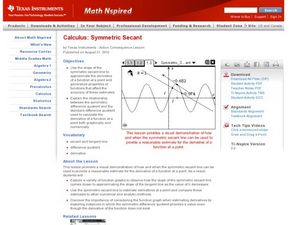
Symmetric Secant
Mathematicians use a symmetric secant line to prove the derivative at a point. In this trigonometry instructional activity, students create secant lines on the navigator to analyze the derivative. They move the lines around and make...
Curated OER
Sequences
Students solve problems using the TI. In this calculus lesson, students evaluate functions using sequences. They graph the functions on the TI and make observations.
