Hi, what do you want to do?
Curated OER
The Babylonian Algorithm, Limits and Rates of Change
For this successive approximations worksheet, students use the Babylonian algorithm to determine the roots of given numbers. They identify the limits of a function, and compute the rate of change in a linear function. This two-page...
Curated OER
Marine Mammal Diving Reflex
Tenth graders discuss marine mammal diving reflex, and measure pulse rate while holding their breath under three conditions: control, warm water, and ice water to determine if humans exhibit marine mammal diving reflex.
Curated OER
Famous Public Properties
Students identify and use the commutative properties of addition and multiplication, associative properties of addition and multiplication, and the distributive property of multiplication over addition.
Curated OER
What Causes the Seasons?
Students conduct experiment to examine how tilt of globe influences warming caused by lighted bulb. They monitor simulated warming of their city by sun in winter and in summer by using light bulb, interpret results, and submit lab report.
Curated OER
MT-A141Precalculus
For this precalculus worksheet, students examine the three problems critically and they find the solutions for the word problems.
Curated OER
Conductivity of salt Solutions
Students investigate the concentration level of solutions. In this math/science lesson, students identify three different ionic compounds. They predict the conductivity of each using their collected data.
Curated OER
The Price Is Right
Students create a list of products with estimated prices. In this algebra lesson, students learn to write equations using variables. They match their created list with that of actual products and compare their prices,
Curated OER
Understanding Equations of Functions
Students write equations for different functions. In this algebra lesson, students observe data and find the function that goes along with that data. The identify the line of best fit.
Curated OER
Exploring the Stock Market
Students explore their options in stocks. In this algebra lesson, students create a portfolio for their future in stocks. they discuss their choices with a broker and presents their portfolio to the class.
Curated OER
Monitoring Oxygen Level
Students measure oxygen percentages in room air and air exhaled after they perform various activities. They explore various websites, and record and analyze the data from the experiments.
Curated OER
Technology - Chaos Theory Lab
Ninth graders gain an understanding of Chaos Theory that exists in one's everyday environment.
Curated OER
Ferris Wheel Problem
Students use two pairs of parametric equations to describe two objects in motion. They determine when two objects are the closest. They simulate the behavior of the two objects and interpret the behavior of the objects in motion.
Curated OER
Energy Content Of Foods And Fuels
Young scholars engage in a study of food and how it used as fuel for the human body. They research how biological systems require energy and compare them to the physical science systems like machines. They compare and contrast what they...
Curated OER
Modeling With Circular Functions
Students explore circular functions. They identify the amplitude, period, phase shift and vertical shift of circular functions. Students analyze phenomena described by sine waves and they find mathematical models for transforming images...
Curated OER
Modeling Population Growth
Students investigate the reasons for taking a census and determine the problems that are involved in the process. They examine the population figure for Montana and Lake county before using the information to complete the included...
Texas Instruments
Texas Instruments: Math Today the Next Frontier for Flight
This activity provides students the opportunity to gain experience in creating circle graphs on the calculator and provides an excellent real-world review of computation with percents.
Texas Instruments
Texas Instruments: Graphing Calculators
Contains information on different kinds of Texas Instruments graphing calculators.
Texas Instruments
Texas Instruments: Differential Equations on the Ti 92 Plus
This activity acquaints students with the features and capabilities of the calculator that are used to study concepts related to differential equations. Students graph and solve a range of differential equation problems.
Texas Instruments
Texas Instruments: Let's Play Ball With Families of Graphs
This activity is designed for students to use real-time data to generate a family of parabolic graphs. The data set will be generated by graphing the heights of a ball bounce with respect to time. Students will determine the regression...
Texas Instruments
Texas Instruments: Implicit Differentiation on the Ti 89
This activity demonstrates implicit differentiation on the graphing calculator.
Texas Instruments
Texas Instruments: Get on the Stick
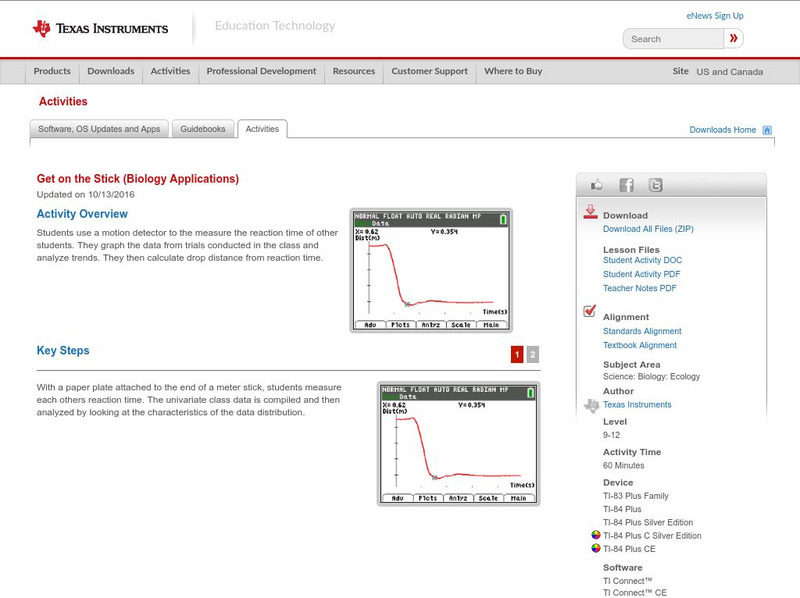
In this activity, students' use a motion detector to the measure the reaction time of students. They graph the data from trials conducted in the class and analyze trends. They then calculate drop distance from reaction time.
University of Illinois
University of Illinois Urbana Champaign: Ti 82 Calculator Tutorial
This site gives an in depth tutorial on the TI-82 graphing calculator. With each step in the tutorial, a picture of the calculator is shown that can be enlarged.
Texas Instruments
Texas Instruments: Numb3 Rs: Seeing in the Dark
Based off of the hit television show NUMB3RS, this lesson has students try to emulate a time vs. distance graph on their graphing calculator using the CBR2. Next, the CBR2 is "swept" across an area in which three students are standing to...
Texas Instruments
Texas Instruments: Where Should They Hold the Fundraising Party?
Students learn how to create a table of values for a simple linear function and use the table to create a graph on squared paper. They use the graphing calculator to display the ordered pairs and find values of corresponding to values of...


