Curated OER
Misleading Graphs
Students explore number relationships by participating in a data collection activity. In this statistics instructional activity, students participate in a role-play activitiy in which they own a scrap material storefront that must...
Curated OER
Dynamite Data
Second graders rotate through a variety of stations designed to offer practice in manipulating data. They sort, tally and count items and then create bar graphs, tables, and pie graphs to record their findings.
Curated OER
Graphing in the Information Age
Students create a variety of graphs based on population data. In this statistics instructional activity, students use data that can be gathered on-line to make a bar chart, line graph, and circle graph.
Curated OER
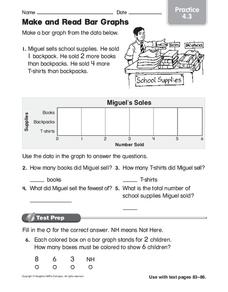
Make and Read Bar Graphs
In this bar graphs worksheet, students make a bar graph about the sale of school supplies with the data presented in one story problem.
Curated OER
Learning to Make Data Tables
Students construct data tables using the results of previous experiments. In this graphing lesson, students plot data and interpret the results. Students discuss how they organized their data.
Curated OER
Seized Before Flights: Graph
In this bar graph worksheet, students analyze a graph that show the number of prohibited items intercepted at U.S. airport screening checkpoints. Students answer 3 problem solving questions about the data on the graph.
Curated OER
Interpreting Graphs
Students investigate graphs. In this graphing lesson, students create a graph regarding the population of California. Students extrapolate answers concerning the data set.
Curated OER
Favorite Candy Bar Graph
Students decide on six different types of candy bars to include in a data collection activity. Working in small groups, they survey a target group in a set amount of time. They access a Internet based graphing tool to create a bar graph...
Curated OER
Line and Double Line Graphs: Reteach
In this graphing worksheet, students review the five steps for making a double line graph to display data. Students then use the graph they made following the shapes to answer the three questions.
Curated OER
Collecting Data
In this data collection worksheet, students read about how data is collected and organized. They also learn about a hypothesis. Students read through examples of different charts and then answer 23 questions pertaining to data...
Curated OER
Bar Graphs
In this bar graphs worksheet, students, working with a partner, explore how to read and analyze the five answers to one mathematical bar graph.
Curated OER
Making a Bar Graph
In this bar graph worksheet, students analyze a data table and bar graph depicting information about stickers collected. Students answer 5 questions about the data displayed.
Curated OER
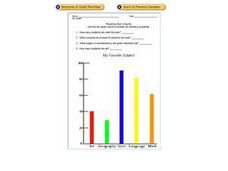
Reading Bar Graphs: My Favorite Subject
In this bar graphs worksheet, learners analyze a bar graph about favorite school subjects. Students use the information on the graph to answer 7 questions.
Curated OER
Favorite Sports Graph
In this data collection and graph worksheet, students ask each classmate which sport is their favorite based on the ones shown at the bottom of the graph. They color a square for each response, and tell the most and least popular sport.
Curated OER
Bar Graphs and Data Analysis
In this graphing worksheet, students look at a bar graph of allowance and dollars. They answer 6 questions related to the bar graph.
Curated OER
Graphing in the Form of Bar Graphs
Young scholars explore bar graphs. In this math lesson, students create and conduct a survey. Young scholars graph their data in a bar graph.
Curated OER
Shopping With a Circle Graph
In this shopping with a circle graph worksheet, students use the data in the graph to answer 8 questions about the money they have and how they can spend it.
Curated OER
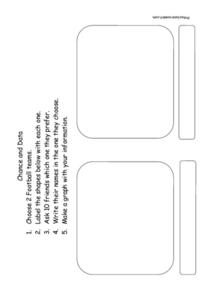
Chance and Data
In this graphing a survey worksheet, learners poll 10 friends to see which of 2 football teams is their favorite and then graph their data results.
Curated OER
Graphing Memories
Mem Fox’s Wilfrid Gordon McDonald Partridge provides the labels for a graphing activity. Class members create an illustration of a memory item brought from home, and place their illustration in the proper column of a graph. When the...
Curated OER
Graphing
Learners collect data to create different types of graphs-line, pie, and bar graphs. They use StarOffice 6.0 to create graphs.
Curated OER
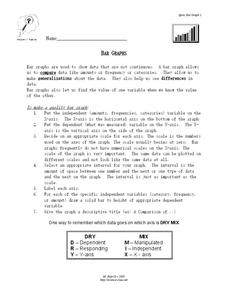
Bar Graphs
In this bar graph worksheet, students read about making quality bar graphs and they make a bar graph using given data. They answer 5 questions about their graph.
Curated OER
Color Graphs and Poetry
Students explore color as they create graphs, write poetry, and examine varied interior designs. They respond to writing prompts describing their favorite color. Students collect data and create a bar graph based on a class survey. They...
Curated OER
Line Graphs Showing Change Over Time
Students analyze line graphs. In this graphing lesson, students analyze line graphs paying attention to how the data changes over time. This lesson includes two video clips, one demonstrating an increasing line graph and one...
Curated OER
Real Misleading Graphs
Students identify real graphs and misleading graphs. For this algebra lesson, students surf the Internet for real life scenarios where graphs are used in a misleading way as well as in a correct way.


