Curated OER
How to Graph in Excel
Fourth graders construct data graphs on the Microsoft Excel program. In this statistics lesson, 4th graders formulate questions and collect data. Students represent their results by using Excel.
Curated OER
Beginning Graphs in MS Excel
Students practice creating graphs in Microsoft Excel. In this technology lesson, students conduct a random survey and collect data. Students use the Microsoft Excel program to create a bar graph of the data.
Curated OER
Graphing Using Excel
Fifth graders complete a series of graphs by gathering information and using Excel to graph the information. For this graphing lesson, 5th graders graph favorite desserts of the class. Student put their results into the...
Curated OER
Small Business
Students simulate owning and running a small business by playing Lemonade Stands. They play the game for three weeks, then work with a partner to produce a Power Point presentation which would be given to a Board of Directors showing...
Curated OER
What's Your Shoe Size? Linear Regression with MS Excel
Learners collect and analyze data. In this statistics lesson, pupils create a liner model of their data and analyze it using central tendencies. They find the linear regression using a spreadsheet.
Curated OER
Graphing With Paper and Computers
Fourth graders construct bar graphs. In this graphing lesson, 4th graders create bar graphs in connection with the story, The Copycat Fish. After creating the initial graphs on paper, students use MS Excel to create graphs.
Curated OER
Excel for Beginners
In this Excel lesson, students set a formula to check their homework. Students also use clipart, work in groups, and learn to use the tools in the drop-down list.
Kenan Fellows
Let's Move
Find a statistical reason for a fresh start. Using a hypothetical scenario, individuals research statistical data of three different cities. Their goal? Find the best statistical reason for a business to move to a new location. Their...
National Research Center for Career and Technical Education
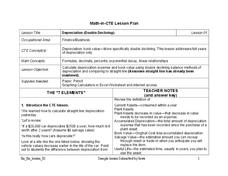
Depreciation (Double Declining)
Have you ever been told that your new car begins to lose its value as soon as you drive it off the lot? Aspiring accountants take on the concepts of depreciation and book value through an easy-to-deliver career and technology lesson. The...
Curated OER
GSE Foundations of Algebra: Equations and Inequalities
Need lessons on writing and solving one- and two-step linear equations and inequalities, as well as systems of equations? This comprehensive 106-page module from the Georgia Department of Education contains many different lessons for a...
Curated OER
World of Work
Twelfth graders research want ads on the Internet or in the newspaper. They calculate the estimated weekly, monthly, and yearly pay for an hourly, salary and commission positions. They calculate a paycheck including state tax, federal...
Curated OER
Your Just Desserts
Students write letters to town officials and local businesses asking for favorite dessert recipes. They tabulate their responses in a spreadsheet. Students turn their survey results into colorful graphs.
Curated OER
Topic 6: Evaluating and Presenting Results
Young scholars construct spreadsheets from raw data. In this spreadsheet construction activity, students compile data into Microsoft Excel. Young scholars familiarize themselves with entering and presenting data in a spreadsheet.
Curated OER
Technobiz
Students examine candy preferences to create a plan in order to improve candy sales. In this technobiz lesson, students build spreadsheet and organizational skills by graphing and calculating data. Students are introduced to terminology...
Curated OER
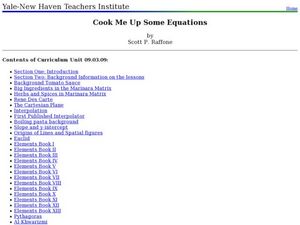
Cook Me Up Some Equations
Students study a variety of math concepts in the context of cooking up a meal. In this math lesson, students calculate surface area and volume. They draw and interpret different types of graphs.
Curated OER
Journalism
Students insert raw data about Ad sales into an Excel chart. They use raw data in a letter to local businesses by using the Mail Merge program. They represent data using tables and graphs.
Curated OER
Buy Low, Sell High
Students investigate the stock market and investing in corporate stocks by creating an investment portfolio. They develop database worksheets that track their stock's performance over a specified period of time. Students use their...
Curated OER
Getting Into Shapes: Identifying and Describing Two-Dimensional Shapes
Young scholars examine their classroom to find examples of various types of shapes. After identifying and describing the various shapes, they draw as many as they can on a piece of paper. They organize them into an image based on their...


